Seven Post-Yugoslav Economies, Seven Paths: Why Did They Develop So Differently After the Breakup?
Why the successor states differ today: starting conditions, wars, reforms, privatization, institutions, EU integration and emigration.
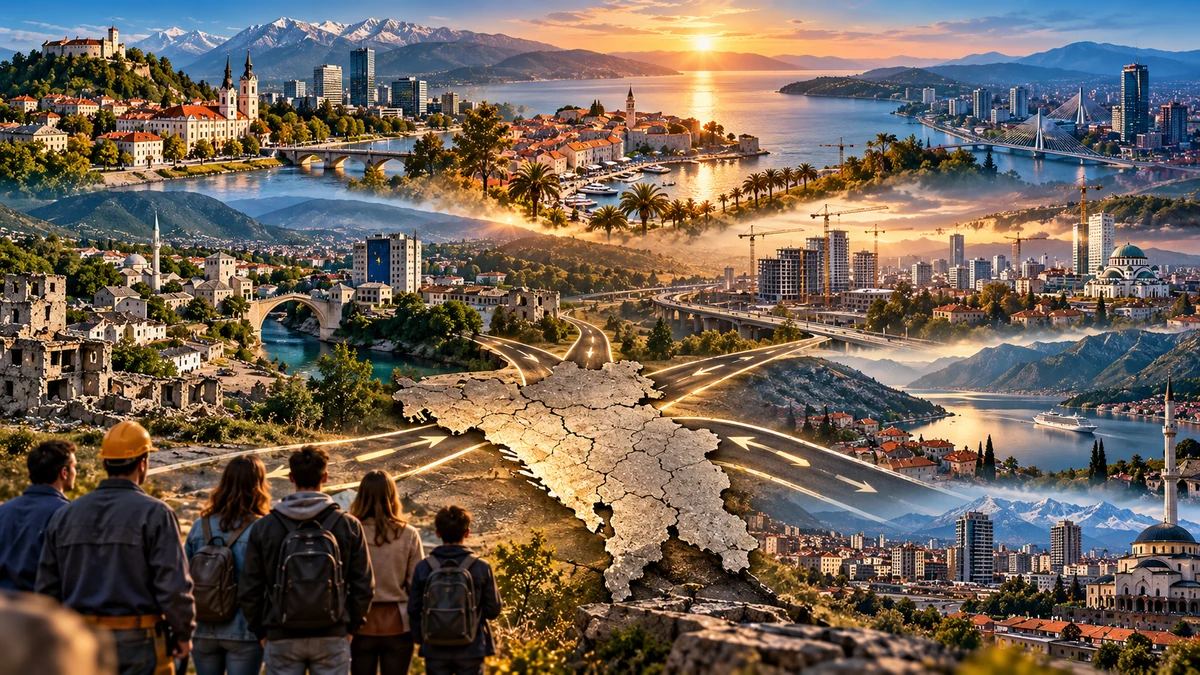
Why not “seven successor states”?
In everyday language we often speak of the “successor states of Yugoslavia.” But in the case of Kosovo, greater precision is required. The 2001 Agreement on Succession Issues of the SFRY was concluded among the then-recognized legal successors of the SFRY. Kosovo was not an independent signatory to that agreement, and its international legal status remains subject to differing positions among states. The European Union therefore uses the designation Kosovo* in legal documents together with a note that this designation is without prejudice to positions on status and is in line with UN Security Council Resolution 1244 and the opinion of the International Court of Justice.[1] This article therefore uses the expression: seven post-Yugoslav economies. This allows an economic comparison of:
- Slovenia,
- Croatia,
- Serbia,
- Bosnia and Herzegovina,
- Montenegro,
- North Macedonia,
- and Kosovo,
without an economic article itself deciding a disputed legal question. The first thing we must reject: in 1991 they did not start as equally developed states. If we want to understand today’s differences, we must begin: before the breakup. The SFRY was one state. But it was not one uniformly developed economy. Data from the Federal Statistical Office, reproduced by the IMF, show gross social product per capita for 1989 with: Yugoslavia = 100. The index was approximately:
- Slovenia: 198
- Croatia: 127
- Serbia proper, excluding Vojvodina and Kosovo: 103
- Montenegro: 73
- Bosnia and Herzegovina: 68
- Macedonia: 66
- Kosovo: 25.[2]
The gap between Slovenia and Kosovo was therefore already before the breakup: almost eightfold in this relative indicator. This is this article’s most important starting safeguard. Today’s differences did not appear from nothing after 1991. A large part of the development map had deep roots within the federation itself. Yugoslavia tried to reduce these gaps — but did not eliminate them.
The federation used a federal development fund, budgetary transfers, development loans and investments in less developed republics and Kosovo. An IMF analysis of fiscal relations shows that Bosnia and Herzegovina, Macedonia, Montenegro and Kosovo received significant resources through the Federal Development Fund and the federal budget.[3] But convergence was not fast enough. Slovenia and Croatia had higher productivity, stronger industrial structures, greater export links with Western markets and higher incomes. Kosovo, Macedonia and Bosnia had lower output per capita, higher unemployment, less capital per worker and in some periods faster population growth. The breakup of the common state therefore hit the different regions: with very different initial stocks of capital, knowledge and institutional capacity.
Slovenia: loss of markets, not years of economic destruction. Slovenia was the richest part of the federation before the breakup. The OECD states that its GDP per capita around 1990 was roughly: USD 6,100, compared with about: USD 3,060 for Yugoslavia as a whole.[4] Independence brought the loss of an important Yugoslav market, recession, monetary separation and the need for rapid export reorientation. But Slovenia did not experience a multi-year war on its territory, mass destruction of industry, or years of international sanctions. The OECD summarizes that in 1991–1993 Slovenia established an independent state, stabilized the economy, introduced its own currency and carried out fundamental economic reforms[4]. That is a very different initial transition environment from Bosnia or Serbia.
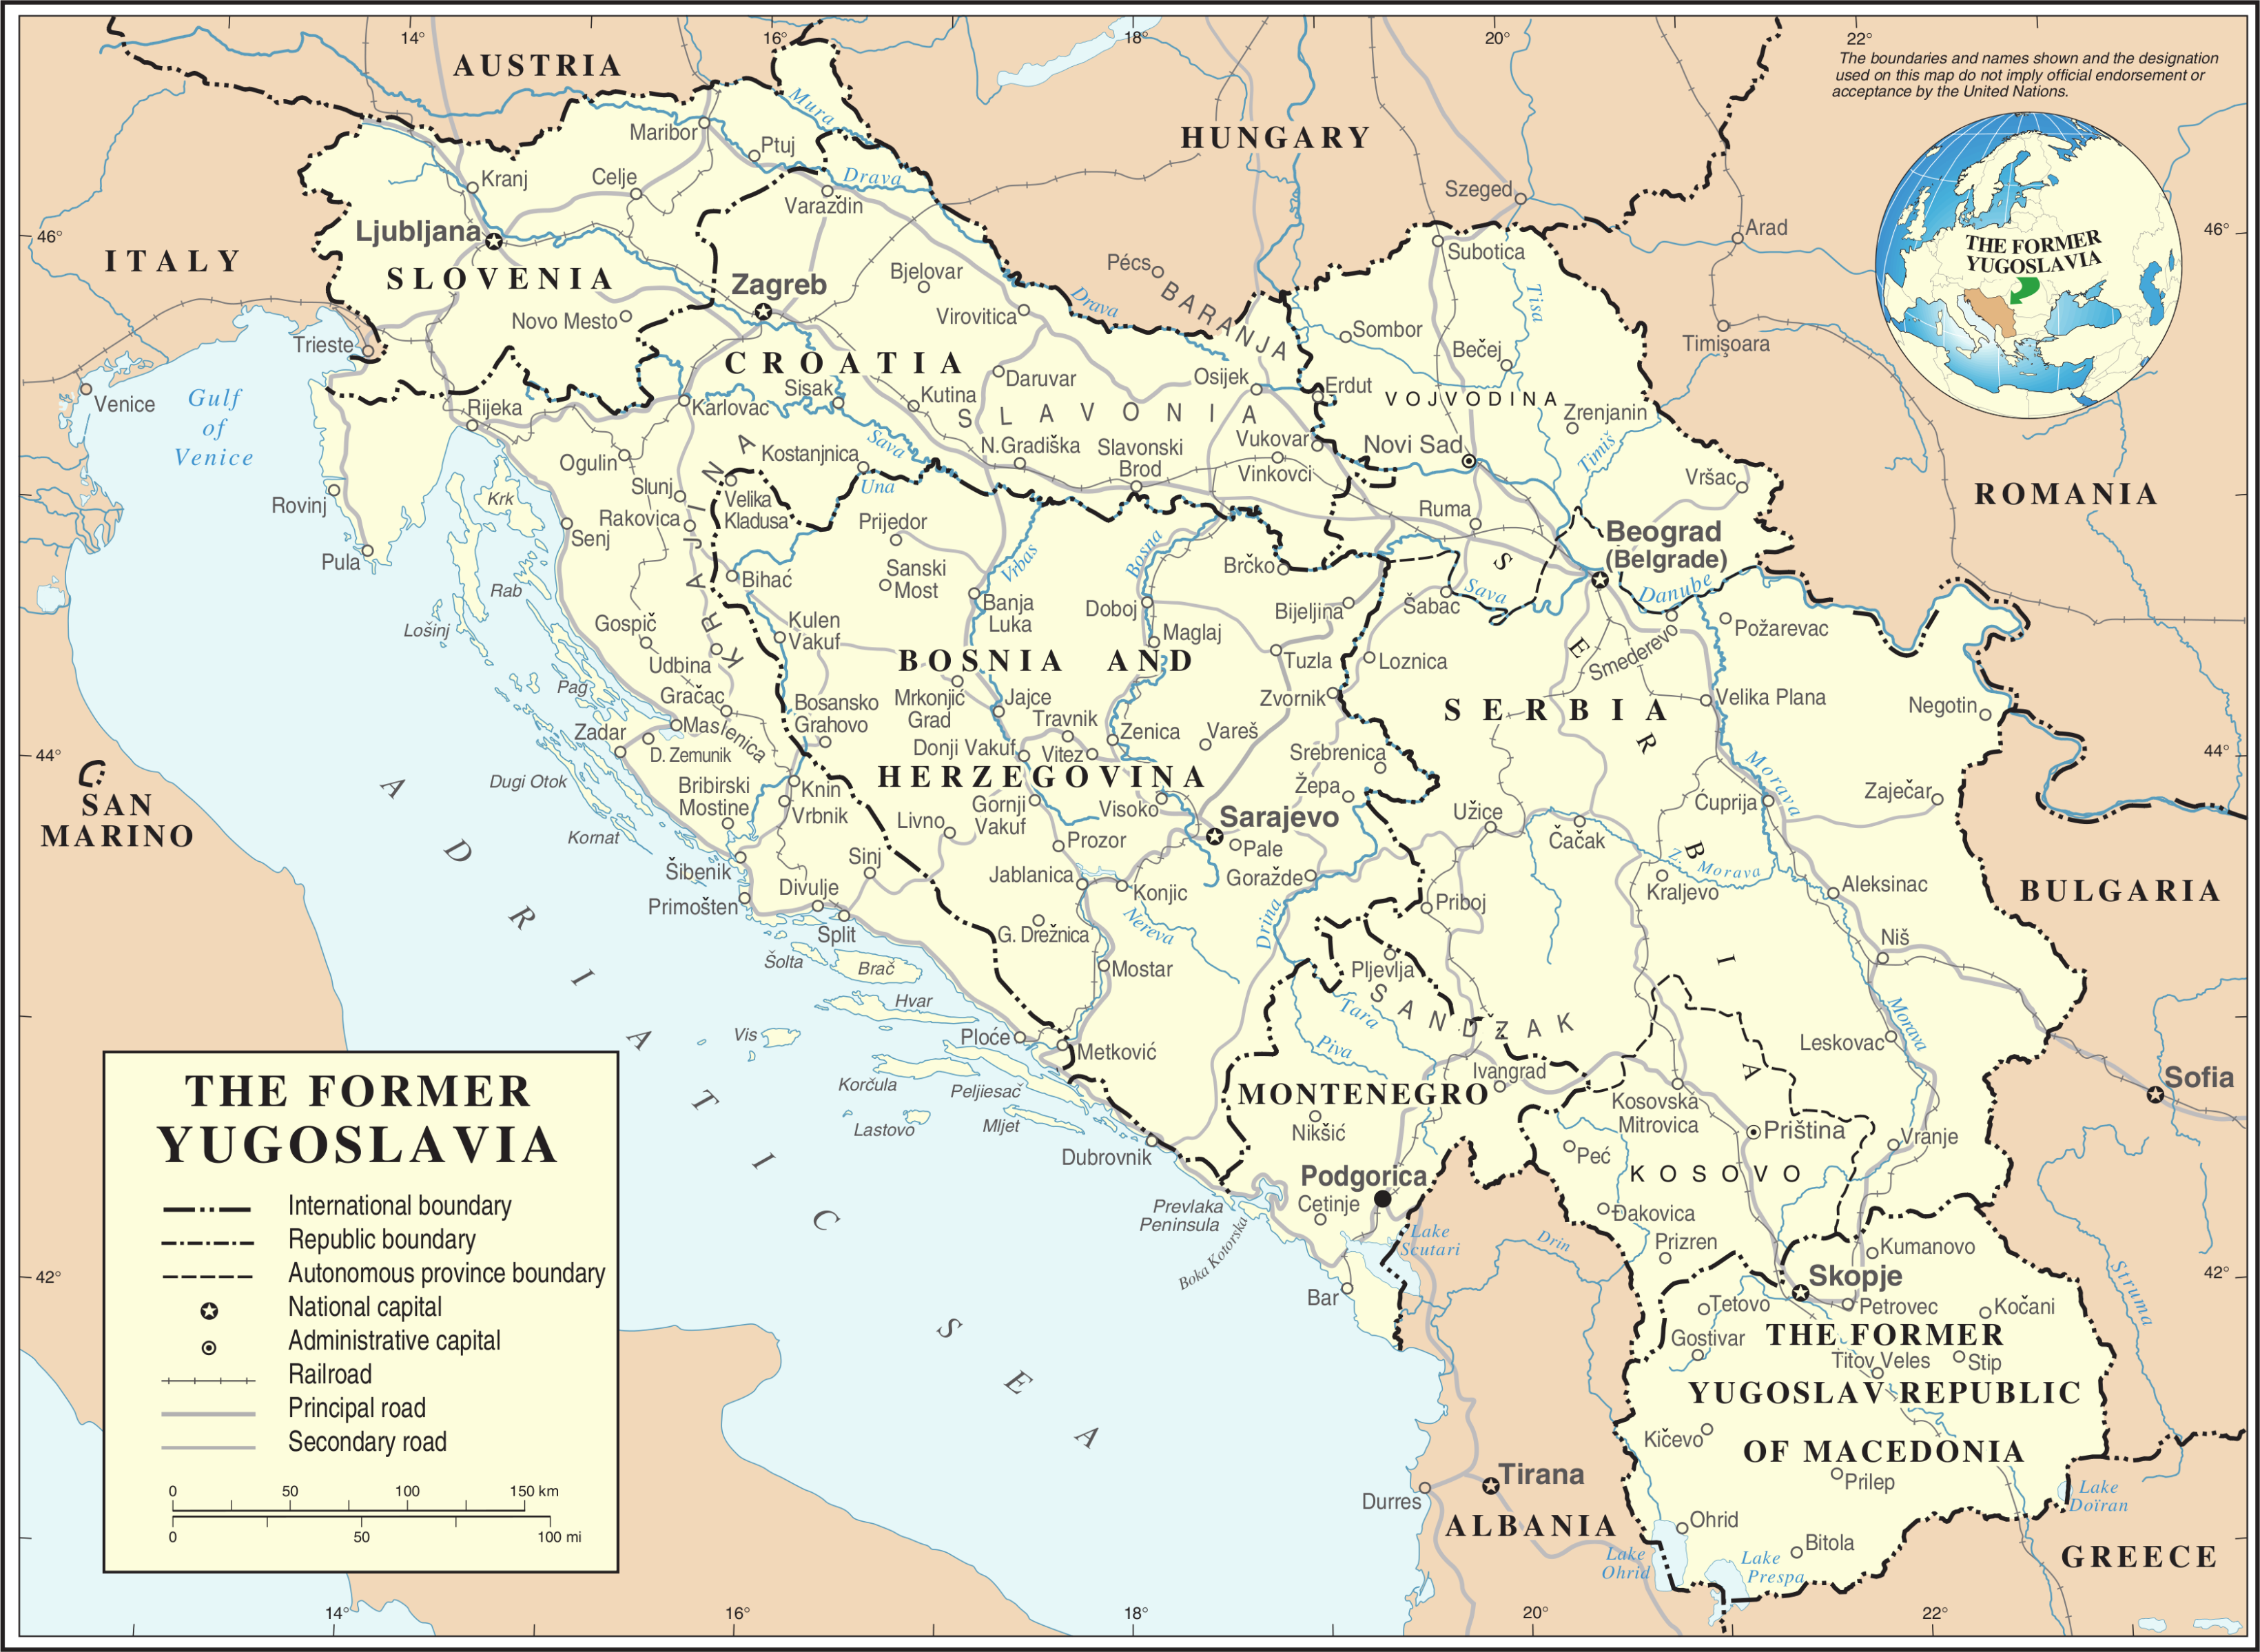
Croatia: the second-strongest starting position, but a multi-year war
Croatia was the second most developed republic in 1989 by gross social product per capita.[2] But the war meant loss of part of the territorial economic space, refugees and displaced persons, high defense expenditure, destruction of infrastructure and disrupted transport and trade flows. The World Bank estimated that by early 1994, relative to the beginning of the transition output had fallen by roughly one quarter, employment had fallen by roughly one quarter and unemployment had roughly doubled[5]. Croatia therefore entered the transition with a stronger initial capital base than most of the federation, but with a much greater war cost than Slovenia. Bosnia and Herzegovina: an almost complete break in economic continuity. Bosnia is a case where the word: transition by itself explains almost nothing. The World Bank estimates that by the end of the war:
- industrial production had fallen to around 5% of the 1990 level in one post-war study;
- around 45% of industrial capacity had been destroyed;
- more than two thirds of housing units had been damaged;
- GDP or GDP per capita had in the worst period fallen to less than one fifth of the pre-war level in some post-war estimates.[6]
Another World Bank series for 1995 gives GDP below one third of the pre-war level and industrial production more than 90% below the pre-war level.[7] Different post-war estimates use different bases and years. But the common conclusion is unequivocal: Bosnia did not move from socialism to a market economy through a normal institutional path. It first experienced an economic collapse caused by war. Serbia: a “lost decade” before most transition reforms actually began.
The World Bank directly describes the 1990s for Serbia as a: lost decade.[8] At the same time the economy was hit by the breakup of the common market, regional wars, international sanctions, hyperinflation, political isolation, delayed structural reforms and in 1999, NATO bombing. By 2000, officially measured GDP was below half the 1989 level.[8] Only after the political change of 2000 did the large wave begin of privatization, bank restructuring, trade liberalization, normalization of relations with creditors and more intensive integration with the EU and foreign investors. This means that compared with Slovenia, Serbia did not enter a broadly similar reform phase: in 1991, but almost a decade later.
Montenegro: less direct wartime destruction, but sanctions, hyperinflation and collapse of the old market. Montenegro did not experience Bosnia-scale destruction on its territory. But as part of the Federal Republic of Yugoslavia it was hit by the breakup of the Yugoslav market, sanctions, monetary instability, hyperinflation and collapse of industrial links. The World Bank Systematic Country Diagnostic describes 1993 as the deepest economic and financial crisis since the Second World War and states that roughly two thirds of the population were below the poverty line.[9] Montenegro later chose a substantially different development model based on services, tourism, foreign investment, real estate, infrastructure and unilateral use of the euro. North Macedonia: a more peaceful political exit did not mean an easy economic transition.
Macedonia left the federation without a war on the scale of Croatia or Bosnia. But the loss of the common market, supply chains, federal transfers and regional stability. was enough to produce a severe economic decline. The World Bank states that between independence and 1995, GDP fell by about: 20%. Registered unemployment exceeded 30%, while inflation reached about 1,700% in 1992.[10] Then came the conflict of 2001. The World Bank estimates that instead of the roughly 6% growth that had been expected, the economy contracted in 2001 by: 4.5%.[11] Thus even a state that avoided a major war at the start of the 1990s did not receive an easy development path.
Kosovo: the poorest starting point, a decade of crisis, and then war. Kosovo was already the economically poorest part of the territory examined here within the SFRY. In 1989, its gross social product per capita, with SFRY=100, was approximately: 25.[2] The World Bank estimated that between 1988 and 1995 GDP contracted by roughly: 50%, amid the broader regional crisis, sanctions on the FRY, and neglect of industry, mining and infrastructure.[12] The war of 1998–1999 then further damaged housing, agricultural assets, telecommunications, equipment and jobs. The World Bank estimated that after the conflict about: 30% of housing units were unusable.[12] Kosovo therefore did not merely begin a transition after 1999. It also began: post-war reconstruction and the building of new institutions.
SECOND DIVIDE: PRIVATIZATION WAS NOT ONE POLICY
One of the most common errors is to say: “they all carried out neoliberal privatization.” The word privatization conceals very different mechanisms. Slovenia: certificates, internal ownership, funds and more gradual sales. Slovenia’s Ownership Transformation Act created a mixed model. The OECD describes a scheme under which part of capital was transferred to the restitution fund, the pension fund and the development fund and investment funds. while the remainder could be privatized through internal distribution of shares, internal buyouts, public sales, tenders and auctions[13]. Employees and former employees had special opportunities and discounts for part of the shares. This was not a pure sale of all capital to the largest foreign bidder. The result was for a longer period: more domestic and insider ownership than in several other successor economies.
Croatia: rapid commercialization and a strong insider model. Croatia adopted the Transformation of Socially Owned Enterprises Act in 1991. The World Bank describes a system in which employees and former employees had priority in purchasing, significant discounts and installment-payment options[14]. By the mid-1990s, a very large share of enterprises had been formally privatized. But the World Bank explicitly describes the model as: insider privatization.[14] Later came additional tenders, voucher privatization for certain groups, sales to strategic investors and greater inflows of foreign capital[15]. Croatia therefore did not have one single wave of privatization either. Bosnia and Herzegovina: post-war privatization, by entities, with vouchers and certificates.
The Bosnian situation was especially complex. Privatization had to be carried out after the war, in a country with two entities, under different legal regimes, amid questions of frozen foreign-currency deposits, military claims, property restitution and mass population displacement. The World Bank documents the use of certificates in the Federation, vouchers in Republika Srpska and special programs for strategic enterprises.[16][17]. That meant a dispersed and institutionally demanding transformation of ownership. Privatization in Bosnia is therefore not comparable with a reform in a country that had an undamaged cadastre, a stable population, a unified regulatory system and functioning banks.
Serbia: privatization truly accelerates only after 2001. New privatization legislation was adopted in June 2001. The model emphasized the sale of a majority stake to a strategic buyer, tenders for large enterprises, auctions for medium-sized enterprises and restructuring of large companies with debt and surplus labor.[18][19]. By the end of November 2008, World Bank data indicate that more than: 2,400 enterprises had been privatized.[20] This model was therefore very different in timing and structure from Slovenia’s or early Croatia’s.
North Macedonia: one of the clearest insider models. The IMF found that by March 1998, about: 87% of employees in privatized enterprises were in companies bought through various forms of insider ownership — management buyouts, employee buyouts and other internal schemes[21]. The IMF explains that firms often chose the privatization method themselves, while employees and managers had informational and financial advantages over outside buyers.[21] The World Bank later found that a large share of insider privatization did not automatically deliver large productivity gains.[22] This is a good example of why: “private” is not a sufficiently precise category.
What also matters is: who owns the company, how it is financed, and whether management actually changes. Montenegro: mass voucher privatization + tenders + tourism. Montenegro used a combination of mass voucher privatization, tenders, auctions and sales to strategic investors. The World Bank states that mass voucher privatization was completed at the end of 2001 and created very broad formal share ownership.[23] At the same time, the role of foreign investors later increased, especially in tourism, hotels, energy, large industrial companies and real estate.
Kosovo: privatization was also a question of the legal status of former socially owned property. After 1999, a basic question had to be answered: who legally manages former socially owned enterprises? The Kosovo Trust Agency was established in 2002. The World Bank at the time noted that there were more than 500 socially owned enterprises, of which roughly 75–100 might be viable for sale as going concerns, while others would require liquidation or another form of treatment.[24] Sale proceeds were held in trust because of potential ownership claims. Privatization was therefore simultaneously an economic, legal, institutional and political process.
Slovenia inherited a strong republican administration. Slovenia did not begin in 1991 without a tax administration, an education system, statistical capacity, banks, industrial companies, local government and legal expertise. It had to create a complete sovereign-state infrastructure, but it did so on the basis of already relatively strong republican institutions. That is substantially different from post-war Kosovo or Bosnia. Bosnia has one of the most complex administrative structures in Europe.
The OECD describes Bosnia and Herzegovina as a highly decentralized state with the state level, two entities, Brčko District and, within the Federation, ten cantons[25]. The entities have broad responsibilities in areas such as health, education, agriculture, labor, police and internal affairs. This system is a political compromise that helped institutionalize the post-war peace. But it also has an economic consequence: many rules, competencies and administrative decision points. The OECD, for example, finds that company-registration procedures and investment rules are not always harmonized across different levels of government.[26] This can increase business costs and make a unified economic policy harder to formulate.
Kosovo had to build a new administrative and market infrastructure after 1999
In addition to rebuilding physical capital, Kosovo built tax institutions, customs, a central-banking framework, regulatory agencies, capital and property markets, business law and local and central government. This means that part of the effort in the first decades went into: building the state or administrative system itself, not only into raising the productivity of an already stable system.
FOURTH DIVIDE: EUROPEAN INTEGRATION IS NOT EVERYTHING — BUT TIMING MATTERS
European integration alone does not explain all development differences. Slovenia was the richest before membership. Croatia was the second most developed already in 1989. But EU integration affects:
- access to the single market;
- competition rules;
- the investment environment;
- infrastructure;
- capital flows;
- labor mobility;
- standards;
- access to European financing.
The timing of integration therefore matters. Slovenia.
- EU: 1 May 2004
- euro: 1 January 2007.[27]
Croatia.
- EU: 1 July 2013
- euro: 1 January 2023.[28]
In 2023 it also entered the Schengen area. Montenegro. Montenegro is a candidate country. Accession negotiations began in 2012. By July 2026, it had opened all: 33 negotiation chapters and had 18 provisionally closed.[29] Serbia. Serbia has held candidate status since 2012. Accession negotiations formally began in January 2014. The European Commission currently lists:
- 22 of 35 chapters opened
- 2 chapters provisionally closed.[30]
North Macedonia. It has been a candidate country since: 2005. The decision to open negotiations was taken in 2020, the first intergovernmental conference was held in 2022, and screening was completed in December 2023.[31] The length of this process is itself an important part of the economic institutional environment. Bosnia and Herzegovina.
Bosnia has been a candidate country since December 2022. In March 2024, the European Council took the political decision to open accession negotiations.[32] But the Commission’s official March 2026 state-of-play still placed Bosnia and Herzegovina among candidate countries: whose accession negotiations had not yet been formally opened, because the negotiating framework had not yet entered into force.[33] The distinction between: a decision that negotiations should open and the formal start of the negotiation process is important. Kosovo. The European Commission currently lists Kosovo as a: potential candidate.[34] A Stabilisation and Association Agreement with the EU exists, but the institutional level of integration is different from that of countries with formally opened accession negotiations.
What does European integration actually mean for the economy? In its Growth Plan for the Western Balkans, the European Commission explicitly identifies the main mechanisms as gradual integration into the EU single market, the regional common market, reforms and increased financing[35]. The OECD estimates that GDP per capita in PPP terms in the WB6 rose by roughly 120% between 2003 and 2023, but in 2023 was still below 40% of the EU average.[36] This means: convergence is taking place, but slowly.
FIFTH DIVIDE: WHAT DOES THE COUNTRY SELL TO THE WORLD?
Development is not only a question of: how much you privatize. It also matters: what you produce and export. Slovenia: industrial-export integration into European value chains. The OECD states that in 2024 Slovenian goods exports were equal to roughly: 63% of GDP. Around: 96% of merchandise exports were produced by manufacturing.[37] Important export groups include pharmaceuticals and chemical products, machinery, electronics and transport equipment. This gives Slovenia a development model that is substantially more: industrial and export-oriented than economies heavily dependent on tourism or remittances. Croatia: tourism as a major strength — and a concentration risk.
Tourism is one of Croatia’s main export sectors. The OECD states that in 2024 it represented roughly: 65.8% of total service exports and generated around: EUR 15 billion in revenue.[38] In 2022 it directly contributed roughly: 12.2% of GDP.[38] This is a powerful source of foreign-exchange earnings. At the same time, it means greater exposure to seasonality, external tourism shocks, real-estate prices, labor demand in services and climate risks. A sector that is a development advantage can therefore simultaneously create: a specific vulnerability. Serbia: a large regional market and a strong wave of manufacturing FDI.
The OECD finds that net FDI in Serbia rose from around: USD 2.3 billion in 2015 to around: USD 4.5 billion in 2023.[39] More than one quarter of these investments were directed toward: manufacturing.[39] This is important. After 2000, Serbia did not develop only a service economy. Part of its development model rests on automotive supply chains, metals, electronics, machinery, export manufacturing and subsidized attraction of foreign direct investment. The question of the long-term quality of this model, however, is not merely: how much FDI arrives, but also how much domestic value added it creates, how much technology transfers, what wages it pays and how many domestic suppliers develop.
Montenegro: a small economy with a very large tourism share. The OECD cites a WTTC estimate that the broader total contribution of tourism in Montenegro in 2023 amounted to around: 26% of GDP.[40] The World Bank describes the country as small, highly open, euroized and heavily dependent on tourism, foreign investment and external financing[41]. This allows rapid inflows in strong tourism years, but increases vulnerability to pandemics, geopolitics, energy prices, real-estate cycles and shifts in tourism demand.
North Macedonia: from insider privatization to manufacturing-oriented foreign capital. After an initial period of low FDI, the structure changed. The OECD states that by 2021 manufacturing accounted for roughly: 35% of total inward FDI stock.[42] This is connected with the development of export-oriented industrial zones, automotive components, electrical equipment and manufacturing supplier chains. Thus today’s economic model is not simply a continuation of the insider-privatization model of the 1990s. It changed over time. Bosnia and Herzegovina: industrial tradition, but a fragmented economic space.
Bosnia has important metal, wood-processing, energy, manufacturing and export sectors. But the OECD warns that the decentralized legal and administrative system creates differences in business registration, rules, competencies and investment procedures[26]. An OECD regional analysis for 2023 places Bosnia near the lower end of the WB6 in net FDI as a share of GDP, at about: 2.6% of GDP.[43] This does not mean decentralization is the only cause. It means that internal institutional fragmentation is one relevant cost to the economy. Kosovo: services, diaspora, real estate and remittances.
The OECD states that around: 72% of employment was concentrated in services.[44] A significant share of foreign capital has historically gone to construction, real estate, financial services and energy. The OECD explicitly connects much of real-estate FDI with the diaspora.[44] Remittances are extremely important. For one set of series around 2022–2023, the OECD gives roughly: 17–21% of GDP, depending on the definition and source used.[45] This supports consumption, construction and household income. But an economy in which a large part of demand is imported through the incomes of people working abroad has a different development problem from Slovenia: how to convert that money into productive investment and export capacity.
SIXTH DIVIDE: THE SAME CURRENCY — OR AN INDEPENDENT MONETARY POLICY?
The monetary paths also diverged. Slovenia and Croatia: the euro through formal membership. Slovenia adopted the euro in 2007. Croatia adopted it in 2023.[27][28] Both are EU members, euro-area members and part of the institutional framework of the European Central Bank. Montenegro and Kosovo: the euro without euro-area membership.
Montenegro unilaterally introduced the euro as sole legal tender in 2002.[46] Kosovo, after using the German mark, likewise unilaterally moved to the euro in 2002.[47] This brings advantages: elimination of domestic currency risk, a monetary anchor and lower transaction costs with the euro area, but also limitations: no independent interest rate, no own exchange rate, the central bank cannot create euros and no standard national lender of last resort. The IMF explicitly highlights these limitations for Kosovo and Montenegro.[46][47] This is a fundamentally different macroeconomic regime from Serbia or North Macedonia.
SEVENTH DIVIDE: DEMOGRAPHY CAN ERASE PART OF ECONOMIC PROGRESS
If GDP grows by 3%, while the population ages, shrinks and emigrates. then a country gets a peculiar development outcome. It can have higher GDP per capita, labor shortages, emptier towns, pressure on the pension system and dependence on immigration. The World Bank estimates that the population of the WB6 fell by about: 8%, or 1.2 million people, between 2000 and 2020.[48] For Bosnia, the same source estimates roughly a: 21% population decline associated with emigration.[48]
The OECD estimates that in 2024 approximately: 23.6% of people born in WB6 countries lived abroad, with estimated rates ranging from around 14% for Serbia to around 33.8% for Bosnia and Herzegovina.[49] This does not mean only: fewer people. It also means fewer taxpayers, fewer workers, fewer potential entrepreneurs, fewer doctors, engineers and skilled tradespeople and but also more remittances and diaspora links. Emigration is therefore: both a buffer and a development cost. TODAY’S OUTCOME: ONE FEDERATION, VERY DIFFERENT INCOME LEVELS. For 2024, the World Bank reports nominal GDP per capita of approximately
| Economy | GDP per capita 2024, current USD | EU position in September 2026 |
|---|---|---|
| Slovenia | 34,301 | EU member; euro |
| Croatia | 24,050 | EU member; euro |
| Serbia | 13,678 | candidate; negotiations opened |
| Bosnia and Herzegovina | 9,398 | candidate; decision to open taken, formal process not yet begun |
| Montenegro | 13,270 | candidate; negotiations opened |
| North Macedonia | 9,292 | candidate; negotiations opened |
| Kosovo | 7,027 | potential candidate |
GDP values: World Development Indicators.[50][51][52][53] This is not a ranking of: “successful” and “unsuccessful nations.” Nominal GDP per capita does not measure:
- housing affordability;
- inequality;
- public services;
- quality of life;
- the informal economy;
- household wealth.
But it does show something that is beyond dispute: after more than three decades, the economic paths diverged very substantially. Slovenia. The highest initial development level + no multi-year war + rapid stabilization + more gradual ownership transformation + early EU integration + strong export industry. None of these components alone explains the result. Together they form a very strong development combination.
Croatia. High initial development + major war damage + rapid insider ownership transformation + later stronger foreign-capital inflows + strong tourism + EU membership since 2013 + euro since 2023. Its path was: slower than Slovenia’s, but not because it began at the same point in 1991 and simply chose a “worse policy.” There was a war in between. Serbia.
Mid-to-high initial industrial base + sanctions and regional wars + hyperinflation + 1999 bombing + almost a decade of delayed transition + rapid privatization and FDI model after 2001 + an important manufacturing base. For Serbia the key question is therefore not only: how fast did it grow after 2000, but: how much development time was lost in the 1990s. Bosnia and Herzegovina. Lower initial development + near-total wartime economic collapse + large-scale reconstruction + an exceptionally decentralized state + complex ownership transformation + major population outflow. Bosnia’s outcome cannot seriously be explained only by privatization, only by domestic politics, or only by international institutions. All of these factors overlap.
Montenegro. Lower initial development + sanctions and hyperinflation inside the FRY + small domestic market + mass privatization + unilateral euroization + tourism, real estate and FDI + a rapidly advancing EU accession process. Its advantage and its vulnerability are often the same thing: small size and openness. North Macedonia. Lower initial development + peaceful separation from Yugoslavia but severe economic contraction + highly insider-oriented privatization + 2001 conflict + later attraction of manufacturing FDI + a long waiting period in the EU process. The case shows: the absence of a major war alone is not enough to guarantee rapid convergence.
Kosovo. The lowest initial development level + deep crisis in the 1990s + 1998–1999 war + post-war reconstruction + building of new institutions + special privatization of former socially owned property + unilateral euroization + a very large diaspora and remittances + a service- and consumption-oriented economy. This is institutionally the most distinctive path among the seven. “Slovenia is richer only because it joined the EU earlier.”. No. It had been the richest republic for decades before the breakup.[2] EU integration is an important subsequent component. It is not the original cause of the entire gap.
“War caused all the differences.”. No. War explains extremely well much of Bosnia’s collapse, much of Croatia’s initial decline and an important part of Serbia’s and Kosovo’s development lag. But North Macedonia had major economic problems even without a multi-year war in the early 1990s. “Whoever privatized faster became richer.”. No. Croatia privatized a large part of its economy very quickly. Slovenia was more gradual. Both are EU members today. North Macedonia privatized a very large share of firms early, but this alone did not create Slovenian productivity.
“Foreign investment automatically means development.”. No. What matters is which sector it enters, how many domestic suppliers it integrates, what wages it creates, how much profit is reinvested and how much technology is transferred. An investment in an export factory, an investment in a bank, and an investment in a coastal apartment are all: FDI, but they have very different development effects.
“A small state is necessarily at a disadvantage.”
No. Slovenia is small. Montenegro is small. Kosovo has a small domestic market. But small size can be combined with export industry, tourism, financial openness, diaspora networks and a regional market. The issue is not simply size. It is: how the economy is connected to a larger market. “It is all about culture or nation.”.
The evidence in this article does not support that conclusion. The seven economies emerged from the same federation and for decades shared much of the legal framework, the monetary system, enterprise organization, infrastructure and education institutions. Their development paths then changed through wars, institutions, reforms, international linkages, investment and demography. An explanation such as: “this nation is simply more capable” is not historical analysis.
THE BIGGEST PATTERN: DEVELOPMENT IS CUMULATIVE
If a country in 1991 is twice as rich, has more productive industry, exports more and has stronger human capital. then it is easier to attract capital, technology and more productive investment. If it then avoids a multi-year war, that adds another advantage. If it then enters a larger market earlier, another. If fewer people leave permanently, another. If it has a simpler regulatory system, another. After three decades, these are no longer: one difference.
They become: the compound interest of history. EUROPEAN INTEGRATION AS AN AMPLIFIER, NOT A MAGIC WAND. EU membership can bring a larger market, capital, a regulatory anchor, infrastructure, cohesion financing and mobility. But the EU does not erase starting productivity, geography, demography, war damage and the quality of domestic governance. Two countries can therefore be: inside the same European framework and still remain economically different. Likewise, two countries: outside the EU can produce different outcomes. INSTITUTIONS ARE NOT AN ABSTRACT MORAL WORD.
When economists speak about: institutions, it can sound like an empty phrase. In practice it means very concrete things. How many days does a company need to register property, obtain a construction permit, enforce a contract, connect electricity, resolve a commercial dispute and receive a clear tax ruling. The OECD finds that a civil or commercial case in the WB6 takes on average about: 572 days, more than twice the EU average of roughly 234 days.[54] Corruption, informality and weak contract enforcement are not only: moral questions. They are: costs of capital and doing business. BUT THE WESTERN BALKANS SHOULD NOT BE FROZEN IN A PICTURE FROM 2000 EITHER.
An important safeguard in this article these economies are not static. The OECD estimates that GDP per capita in PPP terms in the WB6 rose by around: 120% between 2003 and 2023.[36] Serbia now attracts several billion dollars of FDI per year.[39] North Macedonia has a significant manufacturing component in foreign investment.[42] Montenegro is far advanced in EU accession negotiations.[29] Kosovo has improved in several areas of competition policy in recent years, even though major development bottlenecks remain.[55] Bosnia, despite its complex institutional system, has also advanced in several policy areas monitored by the OECD.[56] The article therefore does not describe: “a successful north and a hopeless south.” It describes different speeds, structures and constraints.
WHAT CAN WE CLAIM WITH A HIGH DEGREE OF CONFIDENCE FROM THE EVIDENCE?
The post-Yugoslav economies did not have the same initial development position. Differences in gross social product per capita were already very large in 1989.[2] Slovenia had by far the strongest initial economic starting point. This predated independence and EU membership.[2][4] Croatia also started above the Yugoslav average, but the war caused a major initial shock. Bosnia’s economic collapse was primarily a wartime destruction and displacement problem, not an ordinary transition downturn.
Serbia began most systemic transition reforms substantially later than Slovenia or Croatia. The major reform and privatization wave starts after 2000.[8][18] Montenegro was heavily hit by sanctions and hyperinflation even though it did not experience Bosnia-scale direct destruction. North Macedonia avoided a major war in the early 1990s, but still lost about one fifth of GDP by 1995. Kosovo had by far the lowest starting level of development among the territories examined.
Privatization models differed substantially. Slovenia — mixed model; Croatia — strong insider model; Serbia — later tender/auction/strategic-investor model; Macedonia — pronounced insider model; Montenegro — vouchers + tenders; Bosnia — entity-based certificates/vouchers; Kosovo — KTA and a special regime for socially owned property.[13]–[24] EU integration has followed very different timelines. From Slovenia’s membership in 2004 to Kosovo’s potential-candidate status in 2026.[27]–[35] Sector specialization is now very different.
Slovenia — industrial exports; Croatia and Montenegro — large tourism sectors; Serbia and North Macedonia — important manufacturing FDI; Kosovo — services, diaspora and remittances.[37]–[45] Monetary regimes differ. Slovenia and Croatia are formal euro-area members; Montenegro and Kosovo use the euro unilaterally.[27][28][46][47] Demography and emigration have become first-order economic factors. No single variable explains the full divergence. Not war alone. Not the EU alone. Not privatization alone. Not FDI alone. Not initial development alone. The differences emerge from their combination.
The most precise answer to the title question
Why did the post-Yugoslav economies develop so differently? Because the breakup did not create seven blank sheets of paper. Each territory inherited a different development level, a different industrial structure, different employment conditions and different demography. Then it experienced:
- a different war, or no war;
- a different starting time for reforms;
- a different privatization model;
- a different institutional system;
- a different relationship with the EU;
- a different monetary regime;
- a different sector specialization;
- a different scale of emigration.
After three decades, we are therefore not looking at seven versions of the same transition, but at seven different historical paths that had begun to diverge before the breakup and moved further apart with each subsequent shock, reform and integration step. The next step is more concrete: Who Got the Socially Owned Assets? Major Privatizations, New Owners and Lost Companies from Slovenia to Kosovo.
Sources and further reading
- European Commission. Stabilisation and Association Agreement between the EU and Kosovo*. Status note: designation without prejudice to positions on status and in line with UNSCR 1244/1999 and the ICJ opinion. Source
- IMF / SFRY Statistical Office. Bosnia and Herzegovina Staff Country Report 1996, Table 3 — Gross Social Product per Capita, SFRY=100. For 1989: Slovenia 198, Croatia 127, Serbia proper 103, Montenegro 73, BiH 68, Macedonia 66, Kosovo 25. Source
- IMF. Fiscal Relations in Yugoslavia. Development Fund and federal transfers to less developed republics and Kosovo. Source
- OECD. Regulatory Policy in Slovenia — From independence to post-crisis recovery. Initial development and early stabilization. Source
- World Bank. Croatia — early transition and reconstruction assessments. Output and employment decline and rising unemployment during the war. Source
- World Bank. Bosnia and Herzegovina: Reconstruction and the Transition to a Market Economy. Scale of physical and industrial destruction. Source
- World Bank. Bosnia and Herzegovina: From Recovery to Sustainable Growth. GDP below one third of the pre-war level; industrial production more than 90% lower. Source
- World Bank. Serbia — macroeconomic performance and delayed transition. The 1990s as a “lost decade,” GDP in 2000 below half the 1989 level. Source
- World Bank. Montenegro Systematic Country Diagnostic. Sanctions, hyperinflation, output collapse and poverty in the early 1990s. Source
- World Bank. FYR Macedonia — public finance / early transition review. GDP -20% by 1995, high unemployment and inflation. Source
- World Bank. Macedonia Country Economic Memorandum / post-conflict recovery. 2001 conflict and GDP -4.5%. Source
- World Bank. Kosovo reconstruction and economic development needs. Pre-war poverty, contraction in 1988–95, and 1999 damage. Source
- OECD. OECD Economic Surveys: Slovenia 1997. Ownership transformation model, funds, certificates and insider buyouts. Source
- World Bank. Croatia: Beyond Stabilization. Insider privatization, employee discounts and the Transformation Law. Source
- World Bank. Croatia privatization technical assistance / voucher privatization. Source
- World Bank. Bosnia post-war privatization — Federation certificates and Republika Srpska vouchers. Source
- World Bank. Bosnia private-sector development and capital-market framework after voucher/certificate issuance. Source
- World Bank. Serbia privatization law 2001; majority sales to private investors, tenders and auctions. Source
- World Bank. Serbia Privatization Agency — tender, auction and restructuring model. Source
- World Bank. Serbia — more than 2,400 companies privatized by end-November 2008. Source
- IMF. FYR Macedonia 1998 — privatization by model; dominance of management/employee buyouts. Source
- World Bank. FYR Macedonia — insider privatization and limited productivity gains. Source
- World Bank. Montenegro — mass voucher privatization, tenders and auctions. Source
- World Bank. Kosovo — Kosovo Trust Agency and privatization of socially owned enterprises. Source
- OECD. Western Balkans Competitiveness Outlook 2024: Bosnia and Herzegovina — constitutional and governance structure. Source
- OECD. Bosnia and Herzegovina — investment framework and unharmonised registration/regulation across levels. Source
- European Commission. Slovenia and the euro. EU 2004; euro 2007. Source
- European Commission. Croatia and the euro. EU 2013; euro 2023. Source
- Council of the EU / European Commission. Montenegro accession negotiations; by 14 July 2026 all 33 chapters opened, 18 provisionally closed. Source
- European Commission. Serbia — candidate status and accession negotiations; 22/35 chapters opened, 2 provisionally closed. Source
- European Commission. North Macedonia — candidate since 2005, accession decision 2020, IGC 2022, screening completed 2023. Source
- European Commission. Bosnia and Herzegovina — candidate status and March 2024 European Council decision to open negotiations. Source
- European Commission. State of play EU accession negotiations — March 2026. Bosnia and Herzegovina among candidate countries whose accession negotiations were not yet formally opened. Source
- European Commission. Kosovo — membership status: potential candidate. Source
- European Commission. Growth Plan for the Western Balkans — single-market integration, regional integration, reforms and €6bn facility. Source
- OECD. Economic Convergence Scoreboard for the Western Balkans 2025. WB6 GDP per capita PPP +120% 2003–2023; still below two-fifths of EU average in 2023. Source
- OECD. Slovenia — regional competitiveness / export structure. Goods exports 63% GDP in 2024; 96% produced by manufacturing. Source
- OECD. Croatia — Tourism Trends and Policies 2026. Tourism share of service exports and GDP. Source
- OECD. Western Balkans Competitiveness Outlook 2024: Serbia. FDI 2015–2023 and manufacturing share. Source
- OECD. Tourism Trends and Policies 2024: Montenegro. Tourism and employment contribution. Source
- World Bank. Montenegro country overview. Small, highly open, euroized economy reliant on tourism, FDI and external financing. Source
- OECD. North Macedonia — investment policy and promotion. Manufacturing 35% of inward FDI stock in 2021. Source
- OECD. Western Balkans Competitiveness Outlook 2024 regional business environment. FDI distribution; BiH ~2.6% GDP in 2023. Source
- OECD. Kosovo economic context. Services employment, FDI concentration, remittances. Source
- OECD. Kosovo access to finance / remittances. Source
- IMF. Montenegro — unilateral euroization, 2002. Source
- IMF. Kosovo — Financial Buffers in a Euroized Economy. German mark after 1999; unilateral euro adoption 2002 and monetary-policy limitations. Source
- World Bank. Western Balkans Regular Economic Report, Fall 2024. Population decline, emigration and labor supply. Source
- OECD. Economic Convergence Scoreboard 2025 — emigration rates and shrinking workforce. Source
- World Bank WDI. 2024 GDP per capita: Slovenia USD 34,301; Croatia USD 24,049.9. Source 1 Source 2
- World Bank WDI. 2024 GDP per capita: Serbia USD 13,677.8; Bosnia and Herzegovina USD 9,397.9; Kosovo USD 7,026.7. Source
- World Bank WDI. 2024 GDP per capita: Montenegro USD 13,270.2. Source
- World Bank WDI. 2024 GDP per capita: North Macedonia USD 9,291.9; Kosovo USD 7,026.7. Source
- OECD. Western Balkans Competitiveness Outlook 2024 — business environment. Average civil/commercial case duration 572 days versus 234 in the EU; corruption and contract enforcement as business factors. Source
- OECD. Western Balkans Competitiveness Outlook 2024: Kosovo — executive summary. Source
- OECD. Western Balkans Competitiveness Outlook 2024: Bosnia and Herzegovina — executive summary. Source