Stock Market Indices: Who Determines Where Passive Capital Flows?
How stock indexes set inclusion rules and influence the allocation of passive investment capital.

Editorial allegory: index methodology sets a reference composition, while individual managers independently implement investment strategies. No real financial data are depicted.
When investors buy a unit in an index fund, a single investment can give them exposure to hundreds of companies. But who selected those companies and determined what proportion of the portfolio each should represent? Behind passive investing is a distinct group of financial institutions that can influence capital allocation without directly owning company shares. These are stock market index providers. Their power stems from defining the benchmarks that numerous investment products follow.
The index as a benchmark and an investment mandate
A stock market index is a calculated measure of the performance of a selected group of securities. Its composition, weighting method and rules for changing its constituents determine which part of the market it represents. The index itself is not an investment fund and does not own shares in companies. A fund manager can choose an index as the benchmark to track and construct a portfolio designed to match its performance as closely as possible. An actively managed fund can use the same index solely as a performance benchmark without having to replicate its composition. [1]
In a market-capitalisation-weighted index, the weight of each constituent depends on its market capitalisation relative to the total capitalisation of all index constituents. Indices often take into account only the portion of capitalisation corresponding to shares available for public trading (free float), since not all ownership stakes are equally accessible to ordinary investors. The S&P 500, for example, is constructed in this way. [2] If a share price rises faster than the prices of other constituents of such an index, its weight can increase simply because its market value has changed, without a new decision by the index provider or any additional purchase of shares solely to reflect that change in weight, provided that the fund already fully replicates the index.
Buying a share in a US exchange-traded fund (ETF) does not mean directly buying every stock in its portfolio. The investor typically buys a fund share from another market participant on an exchange. The creation and redemption of large blocks of fund shares take place through authorized participants, who may deliver a basket of securities or cash to the fund, or receive securities or cash from it, under specified conditions. [3] Purchasing an ETF share therefore does not automatically trigger purchases of every stock in the index. Similarly, buying previously issued shares on the secondary market does not generally result in a direct cash inflow to the company that issued them.

S&P DJI, MSCI and FTSE Russell
S&P Dow Jones Indices (S&P DJI) develops indices including the S&P 500, S&P MidCap 400 and Dow Jones Industrial Average. The S&P 500 represents the large-cap segment of the US equity market. It comprises 500 companies, but it is not an automatically generated list of the 500 largest companies; a single company may be represented by more than one security. In an explanation published by the provider in November 2020, size, liquidity, profitability, free float and sector representation are listed among the eligibility criteria and selection considerations. An index committee decides on additions; meeting the criteria alone does not guarantee inclusion. [2][4] Exact thresholds and exceptions may change as the methodology evolves.
MSCI develops global and regional indices such as MSCI World, MSCI ACWI and MSCI Emerging Markets. An important part of its work is market classification. It considers market accessibility for investors, size and liquidity, as well as economic development when classifying markets as developed. [5] MSCI's May 2026 Global Investable Market Indexes Methodology provides for four regular reviews each year, in February, May, August and November. [6] This refers to a dated edition of the rules, rather than making a claim about the contents of all subsequent amendments.
FTSE Russell develops indices including the UK's FTSE 100 and the US Russell 1000 and Russell 2000. The latter two represent different segments of the US equity market according to company size, with their composition determined by methodological rules. [7] In its January 2026 benchmark administration document (v1.8), the provider states that FTSE Russell is wholly owned by London Stock Exchange Group (LSEG), while also describing the organisational separation of benchmark administration and procedures for managing potential conflicts of interest. [8] A description of these procedures is not equivalent to an independent assessment of their implementation.
The business model of index providers
Index providers generate revenue not only by selling data. Their methodologies and names may be licensed to financial institutions that develop investment products. In its 2025 annual report, CME Group discloses a 27 per cent ownership interest in S&P Dow Jones Indices LLC and a long-term licensing arrangement for certain financial products. S&P Global includes the company in its consolidated financial statements and discloses the rights of minority owners. According to S&P Global's investor fact book, S&P Global owns 73 per cent of the company and CME Group owns 27 per cent. The two annual reports for 2025 confirm the minority interest. [9][10][21] Ownership of an index provider is not ownership of the assets that others manage in accordance with its index.
In its 2025 annual report, MSCI reported revenue of USD 1,786.808 million from its index segment. Of this, USD 957.897 million came from recurring subscriptions, USD 770.670 million from asset- or trading-related fees, and USD 58.241 million from other non-recurring revenue. [11] Approximately 43 per cent of the segment's revenue was therefore linked to assets or trading, rather than solely to data subscriptions. These revenues do not represent the value of assets under MSCI's management. The business model creates an economic interest in the use of the indices.
The relationship with major asset managers is also measurable: according to the same report, BlackRock accounted for 10.8 per cent of MSCI's total operating revenue and 18.7 per cent of its index segment's operating revenue in 2025. MSCI also lists potential conflicts of interest involving clients and other stakeholders among its business risks. [11] This is a documented business relationship, not evidence that BlackRock determines index composition or that MSCI adjusts it in BlackRock's favour.
Tesla and the economic reach of the S&P 500
In November 2020, S&P DJI announced the addition of Tesla to the S&P 500. Because of Tesla's size, the provider held a consultation on how the addition should be implemented. On 30 November, it announced that Tesla would be added at its full float-adjusted market capitalisation weight prior to the opening of trading on 21 December 2020. In deciding how to implement the addition, it also considered expected liquidity and the market's ability to accommodate higher trading volumes. [12] In its notice of 11 December, it also identified the company to be removed: Apartment Investment and Management Co. (AIV). AIV was planning to spin off Apartment Income REIT and, according to the provider, would consequently no longer qualify for the market capitalisation range of the S&P Composite 1500 family. [13]

Such a change means that managers whose mandate is to track the index must take its new composition into account when allocating investments. Those already holding the new stock may need to make fewer adjustments than those who do not. The provider's announcement establishes what was decided and when the change was due to take effect, but does not reveal the actual orders placed by each fund, the final execution prices or how much money changed hands. These are distinct research questions.
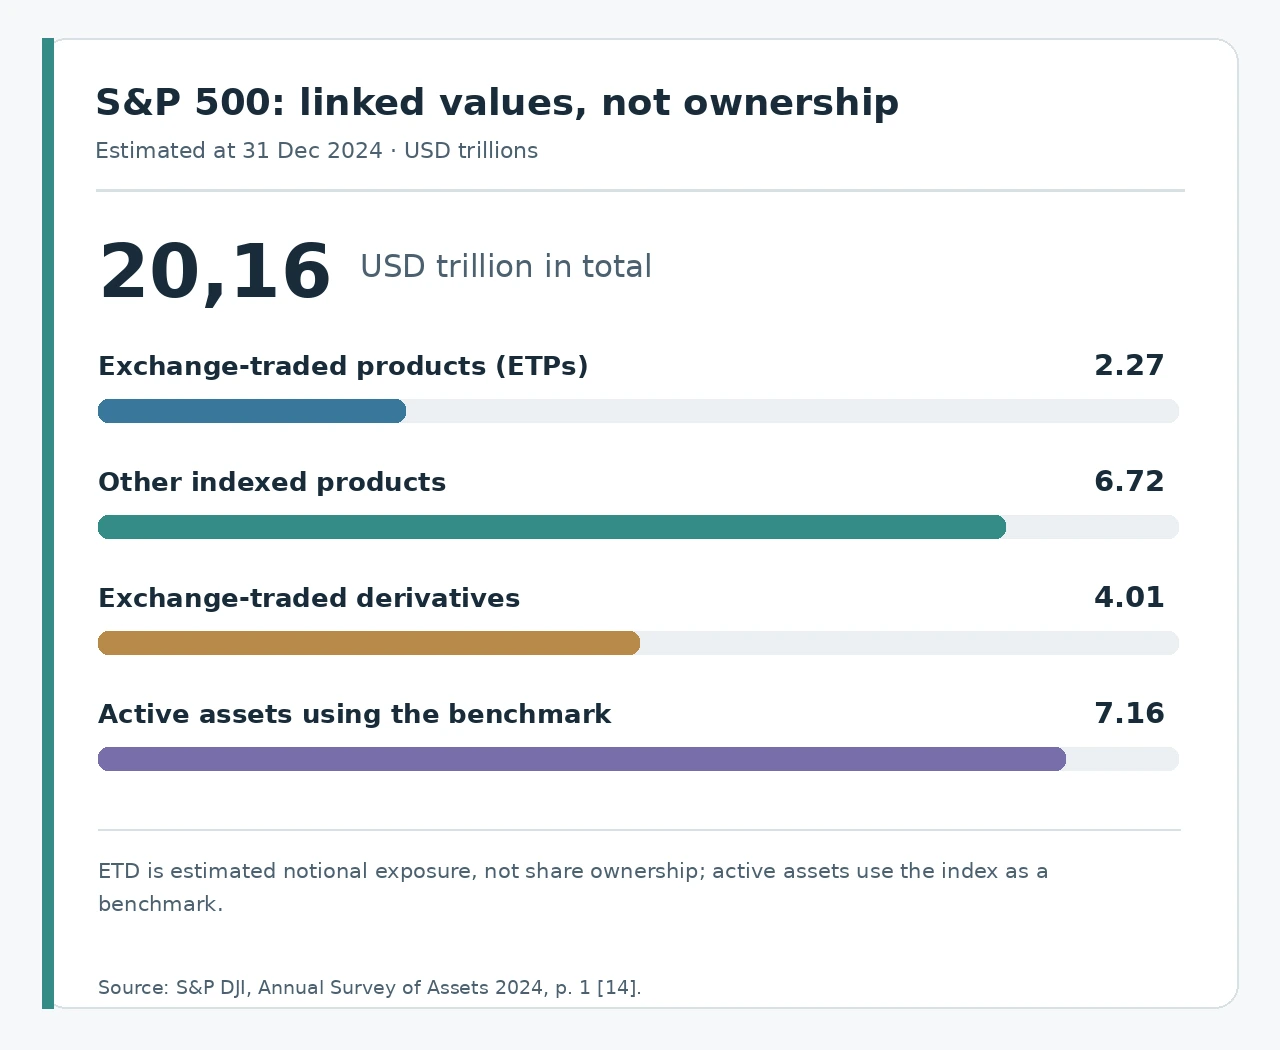
The scale of the potential influence can be illustrated by S&P DJI's annual survey of assets linked to its indices. As of 31 December 2024, the provider estimated the value of assets and products linked to the S&P 500 at approximately USD 20.16 trillion. Of this amount, it classified around USD 13 trillion as indexed products or exposures, including the notional values of derivatives. The remaining USD 7.16 trillion represented actively managed assets using the index as a performance benchmark. [14]
| Category | Value (USD trillions) |
|---|---|
| Exchange-traded products (ETPs) | 2.27 |
| Other indexed products | 6.72 |
| Exchange-traded derivatives | 4.01 |
| Actively managed benchmarked assets | 7.16 |
| Total | 20.16 |
Source: S&P DJI, annual survey of assets, as of 31 December 2024. [14] The first three categories constitute the indexed portion. The figures are rounded estimates made by the provider using survey data and other sources; the provider does not guarantee their accuracy. For derivatives, the figures represent estimated notional exposure rather than the direct value of shares owned by funds. The total amount must therefore not be described as assets owned by S&P DJI, as exclusively passive capital or as assets that would all move following a change in the index. The figures represent a verified historical snapshot rather than the latest estimate.
MSCI and the inclusion of Chinese shares
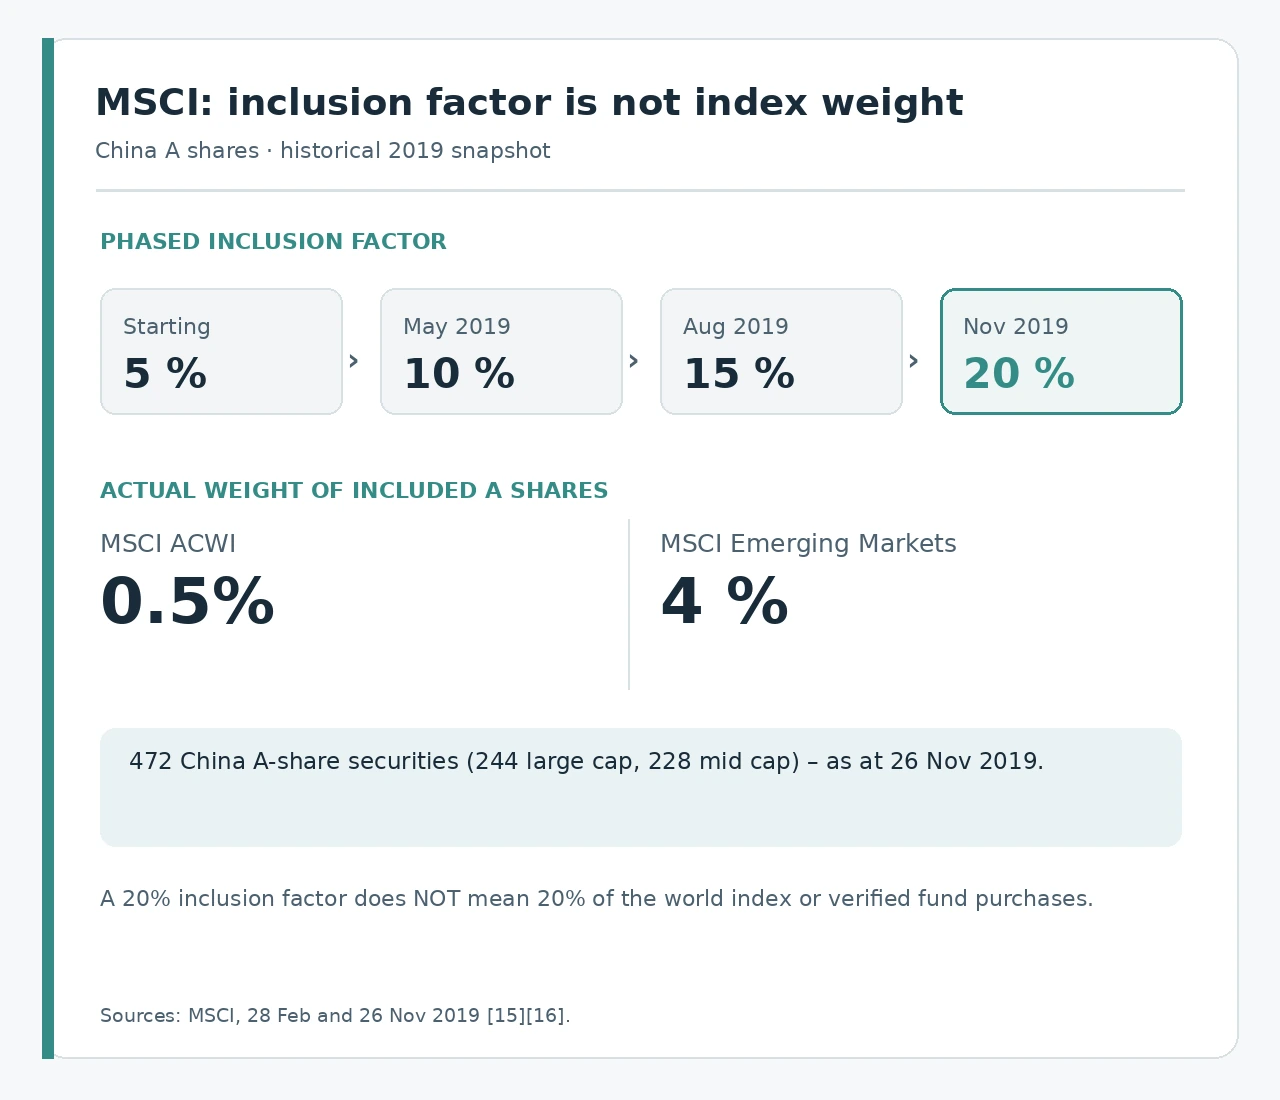
The MSCI case illustrates how an index provider can determine not just which companies are represented but also how a particular market is included. Chinese A shares are listed on mainland Chinese exchanges and traded in renminbi. Following a consultation, on 28 February 2019 MSCI announced a gradual increase in the inclusion factor for large-cap China A shares from 5 to 20 per cent: to 10 per cent in May, 15 per cent in August and 20 per cent in November. The final phase also provided for the inclusion of eligible mid-cap companies. [15]

The inclusion factor determines how much of a particular stock's available adjusted market capitalisation is taken into account when calculating the index. A 20 per cent factor therefore does not mean that China accounts for one fifth of a global index or that funds have acquired one fifth of all Chinese shares. The implications for an individual portfolio depend on its mandate, size and existing investments.
On 26 November 2019, MSCI announced the completion of the final phase. At that point, 472 A shares were reflected in its indices as part of this inclusion, comprising 244 large-cap securities and 228 mid-cap securities. Together, they accounted for approximately 0.5 per cent of MSCI ACWI and 4 per cent of MSCI Emerging Markets. [16] These figures refer to 2019, not to the current composition of the indices or the combined weight of all Chinese shares. The case confirms that a methodological change can alter the target geographic exposure of index products, but does not reveal actual net capital flows.
Russell and three funds tracking the same index
Index composition also changes as a result of regular company reclassifications. According to an official announcement by FTSE Russell in March 2026, the Russell US index family is reconstituted twice a year from 2026 onwards, in June and December. [17] Changes in membership and weights may require adjustments to the portfolios tracking these indices. According to the provider's preliminary announcement of 13 November 2026, the December review envisaged 21 additions to the Russell 1000 and 125 to the Russell 2000; the changes were scheduled to take effect after the close of trading on 11 December. [22] As of 16 November 2026, this remains an announcement, not a final composition or completed trades.
In earlier parts of the series, we examined the major asset managers BlackRock, Vanguard and State Street. Their products, the iShares Core S&P 500 ETF (IVV), Vanguard S&P 500 ETF (VOO) and State Street SPDR Portfolio S&P 500 ETF (SPYM), use the same benchmark index. Despite this common objective, their documentation describes different aspects of index replication. Vanguard's 2026 documentation describes full replication of the index's composition, State Street notes the possibility of representative sampling and differences between the fund's performance and that of the index, and an earlier online snapshot of IVV's portfolio describes the possible use of index futures to align exposure with the benchmark index. [18][19][20]
Similar weights in the same companies across these funds can result from a shared benchmark and do not necessarily require a direct agreement between the managers. However, a common index does not establish that their portfolios, actual transactions or votes are always identical. Such a comparison would require data on the individual funds from the same period and their actual records.
Index power and its limits
Index funds enable investors to diversify their investments and can reduce management costs because they do not require the ongoing independent selection of each investment. Index rules can contribute to predictability and reduce the scope for arbitrary decisions. [1][3] Even a transparent methodology, however, embodies decisions about which markets, companies, ownership restrictions and weighting methods to take into account. Portfolio concentration may arise from the high market values of the largest companies rather than necessarily from a specific committee decision in their favour.
A change in an index can alter demand for shares, but the scale or duration of its price impact cannot be calculated from the amount of index-linked capital alone. Such an assessment must account for prior market expectations, the response of other investors, liquidity and actual transactions. Even a documented influence on an investment mandate is therefore not in itself evidence of a lasting impact on a company's valuation.
Historical data suggest that the price response can change over time. In a study published in the Journal of Finance in 2025, Robin Greenwood and Marco Sammon report a decline in the average excess return relative to expected returns upon the addition of stocks to the S&P 500: from approximately 7.4 per cent in the 1990s to less than one per cent in a later ten-year period. [23] An accessible author manuscript hosted by Harvard Business School examines additions and deletions between 1980 and 2020. [24] This is a historical average, not an estimate of a permanent effect, a prediction for an individual addition or proof that index changes have no impact.
The important question is who selects the benchmark, who determines its composition, who executes the investment transactions and who bears their consequences. Investors and institutions select products or mandates, index providers set the benchmark rules, and asset managers implement investment strategies. An index provider can thus acquire considerable indirect influence over the allocation of capital without having to own the shares in portfolios that track its indices. This form of economic power differs from direct ownership and must be assessed on the basis of appropriate evidence.
In the next part, we will examine another type of financial benchmark: credit ratings, which influence access to financing for governments and companies as well as the terms on which they borrow.
Sources and further reading
- SEC / Investor.gov (2025-04-29). Characteristics of Mutual Funds and Exchange-Traded Funds (ETFs) – Investor Bulletin, passive and active strategies. Source
- S&P DJI (online edition). S&P U.S. Indices Methodology, Index Objective, Highlights; partially accessible methodology. Source
- SEC / Investor.gov (2023-02-23). Updated Investor Bulletin: Exchange-Traded Funds (ETFs), ETF mechanics, creation and redemption of shares. Source
- Hamish Preston / S&P DJI (2020-11-18). Tesla Added to the S&P 500, description of criteria and committee from 2020. Source
- MSCI (undated page). MSCI Market Classification, Market Classification Framework. Source
- MSCI (2026-05). MSCI Global Investable Market Indexes Methodology, May edition, §3.3, p. 58. Source
- FTSE Russell / LSEG (undated page). Russell US Indexes, Russell US index family. Source
- FTSE Russell (2026-01). Benchmark Administration: Governance and Conflicts of Interest Management, v1.8, §3.1–3.2, p. 5 (January visual snapshot; during the repeat review, the text of v1.9 from July 2026 was accessible at the same URL). Source
- CME Group Inc. (2026). Form 10-K for fiscal year ended December 31, 2025, annual report, S&P Dow Jones Indices LLC section. Source
- S&P Global Inc. (2026). Form 10-K for fiscal year ended December 31, 2025, annual report, Note 9. Source
- MSCI Inc. (2026). Form 10-K for fiscal year ended December 31, 2025, MD&A, Index Segment. Source
- S&P DJI (2020-11-30). S&P Dow Jones Indices Announces Implementation of Tesla's Addition to S&P 500, decision on the method of inclusion. Source
- S&P DJI (2020-12-11). Tesla Set to Join S&P 500 & 100; Apartment Income REIT to Join S&P MidCap 400, notice of the company replacement. Source
- S&P DJI (2024-12-31 (snapshot)). S&P Dow Jones Indices Annual Survey of Assets as of December 31, 2024, Headline Indices table, p. 1 and notes. Source
- MSCI (2019-02-28). MSCI will increase the weight of China A shares in MSCI indexes, inclusion plan. Source
- MSCI (2019-11-26). MSCI Completes the Successful Implementation of Final Phase of the 20% Partial Inclusion of China A Shares in MSCI Indexes, completion announcement. Source
- FTSE Russell / LSEG (2026-03-02). FTSE Russell announces 2026 Russell US Indexes Reconstitution schedule, announcement of the 2026 schedule. Source
- iShares / BlackRock (accessible online snapshot 2025-03-21). iShares Core S&P 500 ETF — IVV, earlier online snapshot, benchmark and holdings. Source
- Vanguard (2026-06-30 (image); 2026-09-30 (text)). Vanguard S&P 500 ETF | VOO, dated 2026 versions, p. 1, different snapshots. Source
- State Street (accessible online snapshot 2026-08-06). State Street SPDR Portfolio S&P 500 ETF — SPYM, online snapshot, benchmark and tracking risks. Source
- S&P Global (online investor fact book). How Indices Generates Revenue, ownership of the joint venture S&P Dow Jones Indices LLC. Source
- FTSE Russell / LSEG (2026-11-13). FTSE Russell Begins December 2026 Semi-Annual Russell US Indexes Reconstitution, indexed extract of the official preliminary announcement; direct access unsuccessful. Source
- Greenwood, Robin; Sammon, Marco (2025). The Disappearing Index Effect. Journal of Finance, 80(2), 657–698, publicly indexed publisher abstract. Source
- Greenwood, Robin; Sammon, Marco (undated accessible author version). The Disappearing Index Effect, Harvard Business School, manuscript, textual review of abstract, sample and methodology; not necessarily identical to the published version. Source