When Society Becomes an Interface: Measuring Collective Reality
Measurement helps us see patterns, but indicators can also reshape behavior, allocate power and determine what counts as reality. This article shows how to measure without mistaking the map for the territory.

“Who Takes Care of the Commons?” showed that commons do not survive on goodwill alone. They need rules, responsibility, monitoring and avenues for correction. But as soon as we start tracking water use, school performance, neighborhood safety, community health, economic conditions or people’s satisfaction, a new question appears: what happens when society is increasingly seen through indicators?
Measurement is necessary. Without data it is hard to distinguish impression from trend, exception from pattern, and good intention from actual effect. Yet a measurement is never the whole reality. It selects certain properties, turns them into data and places them in a form that can be compared, ranked and managed.
A metric can be a window onto reality. The problem begins when the window is declared to be the whole landscape.
This article is therefore not an attack on statistics, science or technology. It is an exercise in epistemic and political maturity: how can we use measurement as a tool for shared understanding without allowing numbers to become a substitute for the human beings, judgment and reality they were meant to describe?
Simplification and comparability
Society needs simplifications No community can directly know everything that is happening at every moment. We therefore build maps, censuses, budgets, risk scores, surveys, indexes and dashboards. Such simplification is not manipulation in itself; it is a condition of orientation in a complex world.
But every simplification reveals some things and hides others. If a school is described only by test scores, relationships, curiosity, safety and long-term understanding disappear from view. If an economy is described only by GDP, we do not necessarily see the distribution of gains, health, leisure, environmental quality or unpaid work. Even a good indicator is always a model of something, not the thing itself.
The first question about a number is not only: is it correct? Also ask: what had to be left out for this number to become possible at all?
When different things become comparable Sociologists Wendy Nelson Espeland and Mitchell Stevens use the term commensuration for the process of translating different qualities into a common metric so they can be compared. This is enormously useful. It enables budgets, standards, rankings, prices, scores and oversight across large systems.
But comparability is not merely a technical act. When multidimensional quality is translated into one number, we decide which differences count and which will be temporarily ignored. A hospital rating, credit score, risk index or university ranking is not only a compressed description; it can become a filter through which institutions allocate attention, money, access and prestige.
That is why we need to distinguish useful reduction from ontological substitution. The first says: for this decision we are using a limited proxy. The second quietly begins to say: this proxy is reality.
When measurement changes behavior
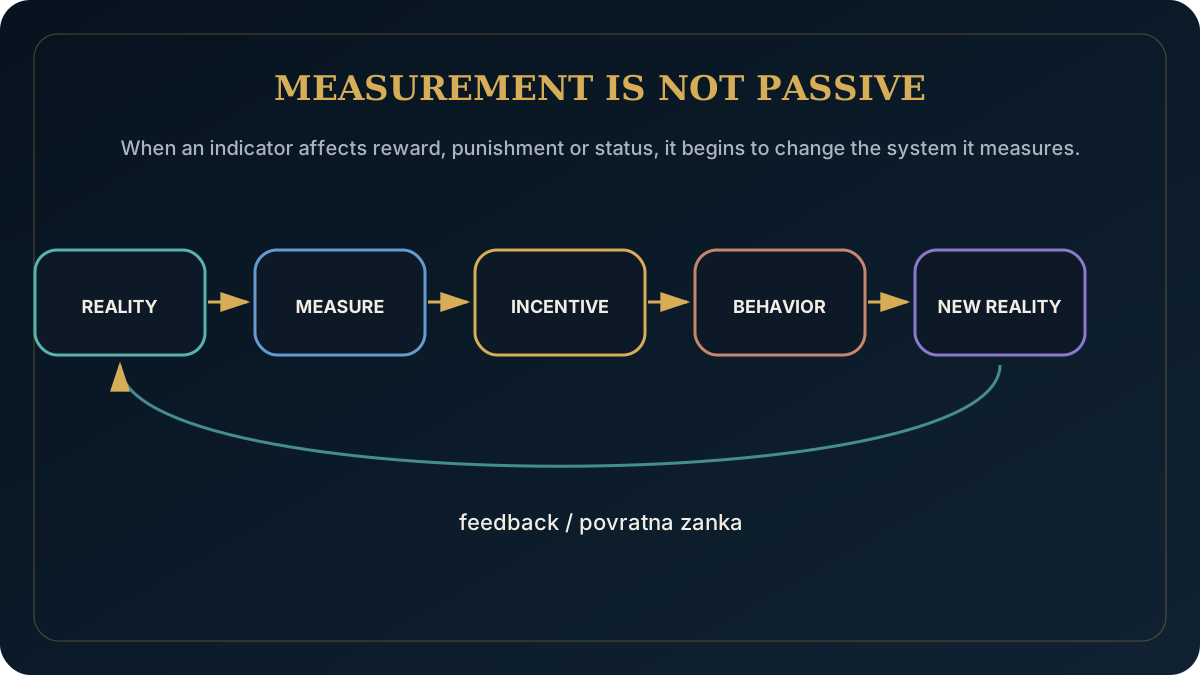
Measurement changes behavior When people know that they are being judged by a particular indicator, they often adapt to that indicator. Espeland and Michael Sauder describe this as reactivity to measurement: public rankings and evaluations do not only measure social worlds; they can change the expectations and behavior of those being measured.
This is not necessarily bad. Publishing waiting-time data can help a hospital identify bottlenecks. Measuring pollution can make an invisible problem visible. But the same mechanism can also create behavior aimed at improving the score rather than the purpose for which the score was introduced.
Once a measure matters for reward, punishment or status, we are no longer measuring exactly the same system. The system has begun adapting to the measure.
Goodhart and Campbell: when an indicator becomes a target Goodhart’s law is often summarized by the idea that a measure ceases to be a good measure when it becomes a direct target. The original idea emerged from monetary policy: a statistical regularity can change once authorities try to use it as a control lever. Donald Campbell similarly warned that intense decision-making pressure on a quantitative social indicator increases pressure to corrupt the indicator and can distort the process the indicator was intended to monitor.
We can see the pattern in teaching to the test, optimized crime statistics, hospital target times, sales quotas and digital engagement metrics. People are not passive components of a model. If they understand the incentive system, they will search for ways to survive or succeed within it.
A good institution therefore does not punish people for noticing a gap between the goal and the metric. That gap is evidence that the system itself may need redesign.
An indicator is not the goal If we want better education, a test score can be a useful signal. It is not education. If we want a safer community, reported crime is important information. It is not safety itself: more reports can sometimes mean greater trust in reporting. If we want a successful economy, production growth matters. It is not by itself proof that quality of life is improving across different groups.
UNDP explicitly notes that the Human Development Index captures only part of human development and requires other indicators for a fuller picture. The OECD likewise uses a broader well-being framework with multiple dimensions of current and future well-being. This does not prove that a perfect index has been found. It acknowledges that a complex social goal should not be compressed into one number.
A good measure answers a limited question. Bad governance starts asking it questions it was never built to answer.
Averages and the conditions for fair comparison
Averages can hide people Social data are often aggregates. An average is useful, but the same average can emerge from very different distributions. Income can rise while part of a community falls behind. Average service access can look good while an outlying group is barely served. Average satisfaction can conceal a small group having extremely poor experiences.
Good public measurement therefore needs to look beyond the center: distribution, group differences, change over time and local context matter. If fairness is the concern, the question is not only how much do we have, but who has access, who carries the costs, and who disappears inside the average.
Comparison requires equivalent measurement Across countries, cultures and groups, the same word or survey item can mean somewhat different things. Research on measurement equivalence warns that comparing means is not secure when an instrument does not measure the same construct in comparable ways across groups.
This matters especially for values, trust, perceived safety, happiness and other subjective attributes. A score may be reported to two decimal places while its meaning still depends on language, culture, sampling and the question that was asked.
A precise record is therefore not the same thing as precise knowledge. Decimal places cannot repair a badly defined concept.
From observation to governance: algorithms, categories, and rankings
From observation to governance When an indicator merely describes a condition, its power is limited. When it starts deciding funding, access, permissions, promotion, prices or scrutiny, it becomes part of society’s operational interface. Measurement then becomes not only an epistemic question but also a question of power.
Ask: who selected the variables? Who sets the weights? Who can inspect the input data? Who audits errors? Who can contest a decision? Who benefits from the fact that a property is measured at all? If these questions have no answer, a technically orderly system can remain politically opaque.
When a number starts opening and closing doors, the number itself must become accountable.
Algorithmic interfaces increase speed — and risk Digital systems can combine more data, detect patterns and route public services more quickly. OECD work on AI in the public sector describes potential gains in productivity, responsiveness and accountability while also warning about biased data, lack of transparency, propagation of errors and risks to trust.
An algorithm is therefore not a magical escape from human bias. It is a formalized procedure that inherits the goals, data, categories and limits of its environment. Automation can make a poor measure faster and more consistent without making it more truthful.
When a system affects rights, access or major life opportunities, practical explainability, traceability, human review and an effective route of appeal become part of responsible design.
Categories are not neutral containers Before we ever obtain a number, we have to define categories. What counts as employment, illness, failure, risk, violence, quality or success? Categories are necessary for organizing data, but the boundary between them often contains judgment. A change in definition can change a statistic even when the world outside the form has not changed to the same degree.
A mature measurement system should therefore preserve a history of definitions and clearly mark methodological changes. If the counting rule changes, the trend before and after the change is not automatically directly comparable. Transparent methodology is not an academic extra; it is part of being fair to the people who will infer reality from the number.
A ranking can begin to create what it was meant only to describe A public ranking affects more than the institution being evaluated. It also affects people who use the ranking to choose a school, place, investment, service or partner. An initial difference in score can therefore attract more resources, prestige and stronger applicants, which may later widen the difference.
Espeland and Sauder describe precisely such feedback and self-fulfilling processes in their study of law-school rankings. This is an important guardrail against the naive idea that a ranking simply photographs pre-existing quality. In some settings, the ranking becomes an active part of the mechanism that redistributes quality, behavior and expectations.
If a public measure changes the flow of people, money and attention, it has become a participant in the system, not merely an observer.
Data hunger is not the same as better knowledge Digital infrastructure creates a temptation to collect everything that is technically available. But more data do not automatically produce a better model. Poorly defined, biased or decontextualized data can simply increase confidence in a wrong decision.
A responsible community therefore collects data for a clear purpose and in proportion to that purpose. It separates personal information from aggregates, limits access, documents provenance and determines when data are no longer needed. The principle is simple: do not collect the person when the question only requires the phenomenon.
How to measure collective reality without mistaking the metric for the goal
What would a good community dashboard look like? Imagine a local view of water conditions, energy, transport access, public-space health and basic costs. A good dashboard would not collapse everything into one large score such as ‘community performance 82/100.’ It would show several distinct dimensions, trends over time, differences between areas, data quality and an explanation of why each indicator was chosen.
For each indicator, a user should be able to see the definition, source, date, uncertainty or limitation, and the responsible institution or person. Major methodological changes would be logged publicly. People could flag missing context and propose additional signals. The dashboard would then function not as a digital throne from which a system declares reality, but as a shared map that can be checked and corrected.
What it means to measure collective reality Collective reality is not one hidden number waiting to be discovered. It is made of material conditions, behavior, relationships, institutions, meanings and experiences. Some parts can be measured directly, some only approximately, and others become intelligible only through narrative, observation and discussion.
A mature measurement system is therefore plural. It combines quantitative and qualitative information, local and wider indicators, present outcomes and long-term consequences. It does not demand that everything be translated onto a single scale. Some differences are better preserved because forced aggregation can create only the appearance of clarity.
Seven rules for healthy use of indicators
- State what the indicator measures and what it does not. Definitions and limits should be visible.
- Use multiple signals. Important decisions should not hang on one number alone.
- Separate measure from target. Where possible, avoid tying reward directly to a single indicator.
- Watch behavioral responses. Check whether people are optimizing the score instead of the purpose.
- Show distributions, not only averages. Ask who remains at the edge.
- Allow audit and appeal. A model error should not become an unchallengeable fate.
- Preserve room for judgment. Data should support responsible decisions, not abolish the decision-maker’s responsibility.
Power, local knowledge, and statistics
Power should be visible on both sides of the meter In a typical monitoring system, the observed party is the one below: student, patient, worker, service user, municipality or citizen. But dispersed power requires measurement of the measurer too. How often does the model fail? Who was harmed? How quickly was the error corrected? Who changed the weights? How many decisions were successfully appealed?
This continues the principle from Who Takes Care of the Commons?: monitoring that serves a community must itself be monitorable. Asymmetric transparency, where an institution sees almost everything about an individual while the individual sees almost nothing about the institution’s rules, is not a neutral information arrangement. It is a power relationship.
Local knowledge and statistics are not enemies In a small community people often know things that a central database cannot see: which spring dries first, who really uses a path, which older resident lacks transport, or why a service exists formally but is inaccessible in practice. Local knowledge is rich, but it can also be biased, incomplete and dependent on personal networks.
Wider data make comparison, pattern detection and testing of local impressions possible. The strongest system therefore does not choose between statistics and experience. It uses each where it is strong and lets each test the other.
Data without context are blind. Context without checking can remain only belief. We need both.
Example: from neighborhood safety to a shared map
Example: did the neighborhood really become safer? Imagine a neighborhood where reported incidents fell by thirty percent in one year. At first glance that is good news. But the same number is compatible with several realities: incidents may truly have declined, people may be reporting less, police may have changed classifications, residents may be avoiding certain places, or the problem may have moved elsewhere.
A mature community would therefore look alongside reports at surveys of perceived safety, emergency calls, health-service data, use of public space, qualitative conversations and differences between locations. None of these sources is perfect. Together they reduce the chance that one number takes over the role of the whole story.
From dashboard to shared map Who Takes Care of the Commons? discussed commons. This article adds that the informational picture of a community can itself function like shared infrastructure. If crucial data are closed, unintelligible or visible only to the operator, people cannot meaningfully participate in judging conditions or rules.
That does not mean personal data should be public. It means the opposite distinction must be clear: transparency of rules and aggregates should coexist with privacy for individuals. A sound public interface reveals enough to audit shared effects without turning the human being into a transparent target of surveillance.
Exercise: audit one metric
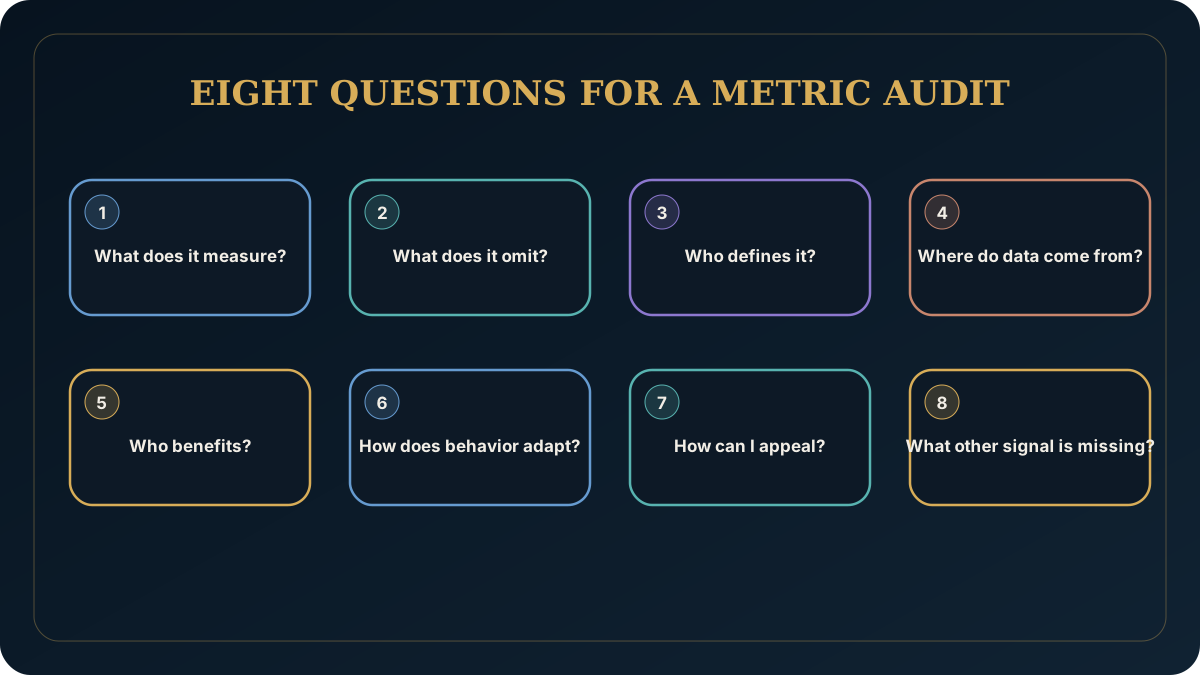
Choose one indicator that affects your life or community: a school grade, credit score, waiting-time target, municipal performance measure, productivity metric, app rating or something else. Then answer eight questions: what exactly does it measure; what does it leave out; who defined it; where do the data come from; who benefits from the result; how do people adapt to the metric; how can an error be contested; and what other signal should sit beside it?
If you cannot answer half of those questions, you have found an important part of the interface that governs reality without being visible enough itself. The next step is not to reject measurement but to demand better measurement, clearer rules and stronger accountability.
Conclusion: numbers should serve reality
A society without measurement is short-sighted. A society that believes only measurements can become blind to everything its system did not know how to encode. Between those extremes lies mature collective judgment.
Data are most useful when they remain auditable, multidimensional and corrigible; when people affected by measurement can understand its purpose and limits; and when a decision-maker cannot hide a political or moral choice behind the apparent neutrality of a formula.
A free community does not reject numbers. It rejects only the idea that a number can remove the human duty to see, judge and answer for consequences.
Sources and further reading
- Espeland, Wendy Nelson & Mitchell L. Stevens (1998). Commensuration as a Social Process. Annual Review of Sociology 24:313–343. Source
- Espeland, Wendy Nelson & Michael Sauder (2007). Rankings and Reactivity: How Public Measures Recreate Social Worlds. American Journal of Sociology 113(1):1–40. Source
- Mennicken, Andrea & Wendy Nelson Espeland (2019). What’s New with Numbers? Sociological Approaches to the Study of Quantification. Annual Review of Sociology 45:223–245. Source
- Campbell, Donald T. (1976/2011). Assessing the Impact of Planned Social Change. Journal of MultiDisciplinary Evaluation 7(15):3–43. Source
- Reserve Bank of Australia bibliography of the 1975 Monetary Economics conference, including Charles A. E. Goodhart, Problems of Monetary Management: The U.K. Experience. Source
- UNDP Human Development Reports. Human Development Index (HDI). Source
- OECD. Well-being Data Monitor and the OECD Well-being Framework. Source
- Davidov, Eldad et al. (2014). Measurement Equivalence in Cross-National Research. Annual Review of Sociology 40:55–75. Source
- OECD (2024). Governing with Artificial Intelligence: Are governments ready? OECD Artificial Intelligence Papers No. 20. Source