Sold Too Cheaply? Anatomy of the Most Controversial Privatizations of Former Yugoslavia: Price, Value, Debt, Land and Final Owners
The sale price is the end point of a process. This article follows price, debt, restructuring, land and the company’s path to the moment of sale.
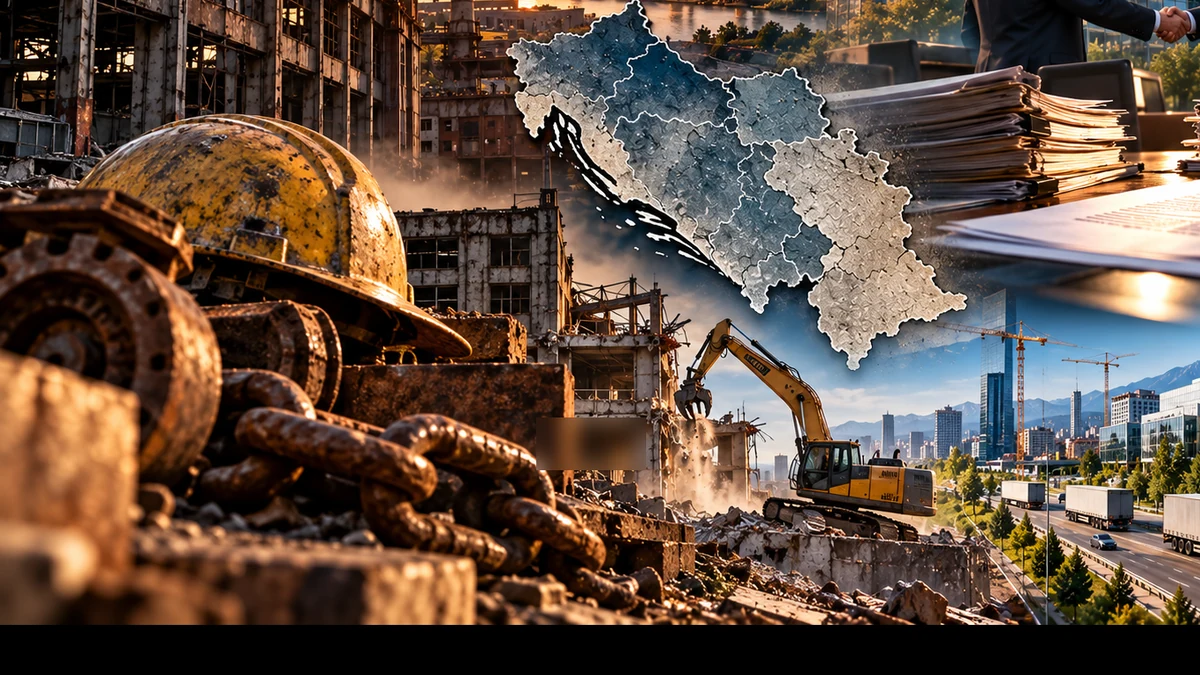
First: what would actually prove that something was “sold too cheaply”?
A serious conclusion requires a reference value. The strongest evidence would be one of the following:
- an independent market valuation from the same period that is materially higher than the achieved sale price;
- a comparable competing offer that was higher and carried comparable conditions;
- the market price of listed shares immediately before the sale;
- a later rapid resale of the same, materially unchanged asset for a substantially higher price;
- proof that the buyer received valuable assets that were not properly captured in the valuation or tender.
Book value, a pre-war valuation, nominal capital or a later value are not by themselves the same as market value on the day of sale. But in a transition-era company the opposite mistake is also dangerous: treating poor condition on the sale date as the beginning of the story. Debt, loss of markets and obsolete equipment can help explain a low price only if we also examine how the debts arose, who made the key decisions, whether assets were shifted before the sale and who benefited from individual steps.
The sale price is often the last photograph in a long film. If a company had a strong brand, productive capacity, land and thousands of employees a decade earlier but arrived at the sale with heavy debt and a depleted balance sheet, the question is not only “what was it worth then?” but also “what happened in between?” A low final value does not by itself prove deliberate weakening. Nor does it by itself rule it out.
Equity value
This is the value of the shares or ownership stake actually being purchased. If a buyer acquires 51% of a company for EUR 100 million, that does not necessarily mean: the whole company is worth only EUR 196 million. Why? Because we must also know debt, cash, other liabilities and minority interests. Enterprise value — the value of the business including net debt. In acquisitions, analysts often consider: equity value + net debt. If the purchaser pays EUR 100 million for the shares, while the company also carries EUR 500 million of debt, the economic scale of the takeover is not merely: EUR 100 million.
Public cost of restructuring. Before a sale, the state may recapitalize the company, assume bad loans, issue bonds, guarantee borrowing, finance severance payments and pay for environmental remediation. That is a cost to taxpayers. But it is not automatically: part of the sale price. The important question is: was the public expenditure needed simply to make the enterprise solvent, or was it effectively a benefit transferred to the incoming buyer? That must be demonstrated separately. Investment and employment obligations of the buyer. A buyer may sign commitments beyond the purchase price:
- EUR 100 million of investment;
- retention of 2,000 jobs;
- environmental remediation;
- assumption of debts.
These are not the same as the cash purchase price, but they are part of the economic package. Later value. If a company is worth three times more ten years after privatization, that alone does not prove: it was sold three times too cheaply ten years earlier. In the meantime the buyer may have invested, acquired other companies, reduced debt, increased earnings and benefited from growth in the overall market. A later price must therefore be: normalized for what changed in the meantime.
CASE 1 — NOVA KBM: “the state injected EUR 870 million and sold the bank for EUR 250 million”
This is one of the most attractive examples for a headline: “the state lost EUR 620 million.” Both numbers are real. But the arithmetic: 870 − 250 = EUR 620 million loss caused by selling too cheaply is not economically valid. What happened? Following the independent 2013 bank review, Nova KBM was found to have a capital need of approximately: EUR 870 million.[1] The state recapitalized the bank. Problem assets were also transferred to: BAMC — the Bank Asset Management Company.[2] In 2015 Slovenia signed an agreement to sell: 100% of NKBM to funds managed by Apollo Global Management and EBRD. Purchase price: EUR 250 million.[3]
Why are EUR 870 million and EUR 250 million not directly comparable? EUR 870 million was not: the state's acquisition cost of the bank. It was capital needed to cover losses and restore capital adequacy. If a bank before rescue has losses, bad loans and negative or insufficient capital. someone must fill the gap. After recapitalization, the bank does not become worth: its previous value + EUR 870 million. Part of that money merely: absorbs past losses. But the public-cost question remains legitimate.
This does not mean the sale price was automatically correct. It means the right questions are different what was the independent value of the cleaned-up bank in 2015, how many candidates submitted offers, what were the sale conditions, what risks still remained in the bank and how many bad assets had already been transferred to BAMC. EBRD states that Apollo/EBRD was selected following a: competitive bidding process.[4] That is an important element of market validation. It is not, by itself, proof of the optimal price. What about the later sale to OTP?
Apollo and EBRD agreed in 2021 to sell NKBM to OTP Group. The transaction closed in February 2023.[5] But: the price was not publicly disclosed.[5] Moreover, the bank sold to OTP was not the same NKBM as in 2015. In the meantime it had, among other things become more profitable, acquired Abanka and Abanka itself had been sold by the Slovenian state to NKBM in 2019 for EUR 444 million[6]. Therefore the claim: “Apollo bought the same bank for EUR 250 million and later sold it for a billion” cannot be properly established from publicly verifiable data. The financial terms of the OTP sale were undisclosed, and the object of sale had changed materially. What can we conclude? Documented:
- EUR 870m capital need;
- EUR 250m sale price;
- transfer of bad assets;
- later growth and consolidation.
But those two numbers do not allow us automatically to calculate: “EUR 620 million of undervaluation.” Proving undervaluation would require: a valuation of the cleaned-up NKBM at the time of the 2015 sale. CASE 2 — NLB: EUR 1.551 billion recapitalization versus EUR 779 million of privatization proceeds.
For NLB the numerical contrast is even larger. In December 2013 the identified capital need was approximately: EUR 1.551 billion.[1] In 2018–2019 Slovenia privatized the majority of the bank. In 2018 approximately: 65% of NLB was sold for about: EUR 669.5 million.[7] After an additional 2019 sale, Slovenia retained: 25% + 1 share. According to a government document, total state proceeds from the NLB privatization were approximately: EUR 779 million.[8]
Does that mean a EUR 772 million loss? Not so simply. The same problem as with NKBM applies the recapitalization covered a balance-sheet hole and stabilized the bank. Moreover, the state did not sell: 100% of NLB. It retained: 25% + 1 share. Therefore comparing EUR 1.551 billion recapitalization with EUR 779 million privatization proceeds is not a complete transaction balance sheet. But the public cost of the banking crisis was real.
In 2013–2014 Slovenia recapitalized six banks with approximately: EUR 3.647 billion. Problem exposures from four banks, with gross exposure of approximately: EUR 4.9 billion, were transferred to BAMC at a transfer value of approximately: EUR 1.6 billion.[2] That was a major public-finance cost. But this article does not rename that cost: “the buyer's discount on NLB.” These are two separate issues the cost of the banking crisis and rescue and the later privatization price.
CASE 3 — PLIVA: what happens when two strategic buyers actually compete?
PLIVA is an important control case. Not because it proves: privatization is good. But because it shows what: competitive market price discovery looks like. The first offer was not the final offer. In June 2006 Barr Pharmaceuticals announced a proposed acquisition of PLIVA worth approximately: USD 2.2 billion.[9] In August Actavis raised its offer to: HRK 795 per share, valuing the company at approximately: USD 2.5 billion.[10] Barr then raised the price again. Final offer: HRK 820 per share or approximately: USD 2.5 billion in cash.[11] Approximately: 92% of the shares were tendered to Barr.[11] Why is this case methodologically important? Because we have:
- two serious strategic buyers;
- public offers;
- a rising price;
- a large number of shareholders;
- a formal tender offer.
When Actavis declined to exceed HRK 820, it withdrew its bid.[12] That is much stronger evidence of market price than: a political estimate of what the company “should have been worth.” Does that mean the price was perfect? No. Even in a competitive auction a buyer can overpay, sellers can accept too little and synergies may be valuable only to a specific bidder. But the PLIVA case has far stronger market-price evidence than a deal with: only one qualified bidder. CASE 4 — INA: initial price, later higher price and the issue of governance rights.
In 2003 the Croatian government approved the sale of: 25% + 1 share of INA to MOL.[13] MOL's historical investor material cites a purchase price of: USD 505 million.[14] Five years later the market picture was different. In 2008 MOL made a voluntary public offer of: HRK 2,800 per share. HANFA reported that this was approximately: HRK 266.66 above the weighted average stock-market price during the three months before the offer announcement.[15] MOL increased its holding through that offer. According to MOL's own disclosure, it spent approximately: USD 1.18 billion for an additional package of about: 22.15%.[14]
Does the higher 2008 price prove the 2003 25% stake was sold too cheaply? Not automatically. Between 2003 and 2008 there were changes in oil prices, INA's business performance, capital-market conditions, the strategic value of a larger stake and the value of governance influence. And a 25% + 1 package is different from a later increase toward almost half of the company. Where, then, is the core of the dispute?
INA became politically and legally controversial particularly because of later shareholder agreements, governance rights, the gas business and interstate arbitrations and domestic legal proceedings. ICSID concluded one of the disputes between MOL and Croatia in 2022; it rejected most of MOL's monetary claims while accepting a smaller part.[16] This article therefore does not infer from the difference between the 2003 and 2008 prices alone: “proven undervaluation in 2003.” That would require a reliable like-for-like valuation of INA in 2003.
CASE 5 — SARTID / SMEDEREVO STEELWORKS: USD 23 million for a steelworks with USD 1.7 billion of debt
This is one of the best-known cases in Serbia. And one of the best examples of why a headline number can simultaneously: shock and mislead. Sale price. In 2003 U.S. Steel acquired Sartid and related steel assets for a total of approximately: USD 23 million.[17] Serbia's Anti-Corruption Council examined and criticized the bankruptcy and sale process in detail.[18] But the buyer did not assume USD 1.7 billion of old debt. Contemporary international reporting estimated Sartid's debt at approximately: USD 1.7 billion.[17] U.S. Steel did not assume these debts as part of the purchase price.[17] It also announced approximately:
- USD 150 million of investment in production improvements;
- additional environmental and community investment.[17]
What does USD 23 million mean? If someone says: “a billion-dollar steelworks was sold for USD 23 million,” they first need to establish the productive capital value, how much debt was realistically recoverable, where the debt remained legally, the condition of the equipment, whether a competitive offer existed and whether the bankruptcy procedure was lawful and properly conducted. The latter issue was specifically criticized by the Anti-Corruption Council. That is: a serious procedural question. But it is not the same as the arithmetic USD 1.7 billion old debt minus USD 23 million purchase price = USD 1.677 billion gift to U.S. Steel. Debt was not equity value. It was a liability.
The most interesting later data point: in 2012 the state buys the plant back for one dollar. After the global steel crisis and operating losses, U.S. Steel sold the Serbian operation back to the state for: USD 1 in 2012.[19] If the later price alone were proof of value, we would have to conclude: U.S. Steel overpaid in 2003. That would also be wrong. In between, the company produced, exported, invested and experienced the global financial and steel crisis.
In 2016 a new buyer pays EUR 46 million. Serbia sold 98 asset units of the Smederevo steelworks to Hesteel in 2016 for: EUR 46 million.[20] The buyer was the only bidder, and the price was above the tender minimum.[20] Planned investment was around: EUR 300 million, with retention of approximately 5,050 jobs.[21] For the same industrial complex we therefore have:
- 2003: approximately USD 23m;
- 2012: USD 1;
- 2016: EUR 46m for asset units.
These are not three “true values.” They show: how strongly valuation of distressed industry depends on time, debt, market conditions and sale structure.

CASE 6 — BH STEEL ZENICA: USD 80 million for 51%, but a plant that had been idle for years
In 2004 Mittal acquired: 51% of BH Steel Zenica for approximately: USD 80 million.[22] The agreement contained an additional: USD 200 million investment commitment over the following decade.[22] Why is the USD 80 million number alone insufficient? The World Bank emphasized that the complex had been: largely idle for years after the war.[22] The buyer did not receive: a fully operating 1989-era Zenica steelworks. It received an industrial complex requiring rehabilitation, capital, restart of supply chains and access to markets. That is a different economic object.
Was it sold too cheaply? This article did not find, in the public sources used here, a sufficiently comparable independent valuation of the same 51% stake in 2004 to calculate undervaluation fairly. We can document the purchase price, the investment obligation, the condition of the plant and Mittal's later consolidation of majority ownership. We cannot infer solely from the physical scale of the factory that: “USD 80 million was too little.”
CASE 7 — KAP PODGORICA: low initial purchase price, then major state guarantees and bankruptcy
Kombinat aluminijuma Podgorica is one of the most complex cases in the entire series. Privatization in 2005. The sale agreement for approximately: 65.44% of KAP specified: EUR 48.5 million.[23] The buyer was linked to CEAC/En+ and Russia's Rusal. The state then assumes major financial risk. After the global crisis, KAP's position deteriorated severely. In 2012 the IMF reported:
- approximately EUR 350 million of total KAP debt;
- about EUR 132 million of debt covered by state guarantees.[24]
In 2013 Montenegro paid approximately: EUR 102.5–102.8 million because KAP guarantees were called.[25][26] That is more than twice the original privatization purchase price. Does this prove the 2005 sale was too cheap? Not directly. It proves something else: after privatization the state once again assumed a very large share of the private company's financial risk. That is the essential finding. If an enterprise is privatized for EUR 48.5 million, but a few years later the public budget guarantees more than EUR 130 million of its debts, the relationship between private ownership, private return and public risk. changes dramatically.
Then comes bankruptcy. Bankruptcy began in 2013. In 2014 KAP's bankruptcy assets were sold to: Uniprom for: EUR 28 million.[27] Official documentation also cited planned investment of approximately: EUR 76 million.[28] Important distinction: shares were sold in 2005; bankruptcy assets in 2014.
These are not the same transaction. 2005: 65.44% of the company's equity. 2014: assets of the bankrupt debtor. It is therefore misleading to say EUR 48.5 million in 2005 versus EUR 28 million in 2014 = the company lost only EUR 20.5 million of value. Between the two transactions were debts, state guarantees, subsidies, bankruptcy, legal disputes and changes in aluminium prices. KAP is therefore above all a story of socialized risk. The strongest documented conclusion is not: “sold too cheaply.” It is: private ownership did not prevent the state from later assuming a very large share of credit risk. That is measurable and demonstrable.
CASE 8 — STOPANSKA BANKA: sale after the balance sheet was cleaned with government bonds
North Macedonia's Stopanska Banka is almost a textbook example of why restructuring cost must be separated from the purchase price. Condition before sale. At the end of the 1990s the bank was in serious difficulty. The IMF describes liquidity problems, large bad loans and problematic major borrowers[29]. Before the sale, the government cleaned up the bank by issuing euro-denominated bonds in exchange for bad claims on its four largest debtors. Nominal amount: DM 235 million.[29]
Sale price. For approximately: 85% of the ordinary share capital the agreed price was: DM 94 million.[29] The principal investor was National Bank of Greece, alongside EBRD and IFC. The government expected to receive approximately: DM 60 million from the sale of its own shares and premiums.[29] Was the bank therefore “sold for a quarter of what the state had just put into it”?
That headline would be misleading. DM 235 million represented: the exchange of bad loans for government bonds. That was balance-sheet cleaning. DM 94 million was: the price for 85% of the ordinary shares. They are different economic categories. But the case clearly demonstrates: private privatization became possible only after major public balance-sheet restructuring. That is a legitimate question about the distribution of costs and benefits. CASE 9 — MAKEDONSKI TELEKOM: EUR 343.3 million for 51%.
In January 2001 a consortium led by Matáv purchased: 51% of Makedonski Telekom for: EUR 343.3 million.[30] The original tender offer had been higher: EUR 362.5 million, but the final price was reduced because fewer creditor claims were converted into equity than initially expected.[30] Why does this detail matter? Because it shows that: a change in sale price is not necessarily a discount. The: object of the transaction may have changed. If less debt is converted into shares, the capital structure is different, and so is the price of a 51% equity package.
Privatization proceeds had macroeconomic significance. The IMF later reported that the state received approximately: USD 323 million in foreign-exchange privatization proceeds from the telecommunications transaction in early 2001.[31] The money also acted as a significant reserve buffer during a year of political-security crisis. The transaction therefore cannot be reduced to: “the telecom went to foreigners.” It was also a major public-finance and macroeconomic event.
CASE 10 — FERRONIKELI: a case where a documented higher bid actually existed
Ferronikeli is one of the most interesting this article cases, because here we are not only talking about: a theoretical higher value. There is a documented second bidder with a higher nominal offer. First procedure: approximately EUR 49 million. In May 2005 Radio Free Europe reported that Albanian-American: Adi-Nikel became the provisional winner with a bid of approximately: EUR 49 million.[32] There were only two bidders, which raised questions under KTA rules concerning minimum bidder numbers.[32][33]
Final sale: Alferon. KTA later selected: Alferon as the final purchaser. Contemporary reports cite an offer figure of approximately: EUR 33 million.[34] The final PAK document records: EUR 30,554,371 as the sale price, plus: EUR 20 million in investment commitments and a gradual employment commitment of up to: 1,000 workers.[35] Does this prove it was sold too cheaply?
This is a much stronger indicator than in many other cases, because there was: a higher nominal competing offer. But we still need to know whether both bids were legally qualified, whether they contained the same investment and employment obligations, whether the higher bid was binding and why the first procedure changed or ended differently. Research literature and contemporary reporting criticized the process.[33][36] That supports the formulation: “a serious procedural and pricing question.” It does not support, without further judicial findings, the formulation: “proven theft.”
CASE 11 — SHARRCEM: EUR 30.1 million, but without a classic open auction. In 2010 PAK sold the Sharrcem cement plant to: Titan. Purchase price: EUR 30.1 million. Investment obligation: EUR 35 million over five years. Employment obligation: 503 workers for a defined contractual period.[37] Why is this case not ideal for determining a “fair market price”?
PAK states that the sale was completed through: direct negotiations in light of the existing lease relationship and right of first refusal.[37] That means less direct price discovery than in an open contest among multiple buyers and but also that the existing operator already knew the plant and had previously invested. A later PAK report also showed a dispute over how much of the contractual investment obligation had actually been fulfilled.[38] Titan later claimed it had invested the full EUR 35.1 million by the end of 2015, while PAK's own calculation indicated a lower figure.[39] This is a case in which: fulfilment of the investment component itself became part of the valuation dispute.
Pattern A: the state restructures — the private buyer purchases. Examples NKBM, NLB and Stopanska Banka. Key question: how much of the old losses were socialized before the company acquired a positive market value? Pattern B: low purchase price + huge historic debts. The clearest example: Sartid. A low purchase price alone does not necessarily mean a low economic transaction value when debt is enormous. But if the debt remains with a public or old legal entity, we must also show: who ultimately carried that debt.
Pattern C: the buyer acquires the firm, the state later assumes new risk. The strongest example: KAP. This is something different from an undervalued sale. It is: privatization followed by socialization of risk. Pattern D: competing offers increase price. The clearest example: PLIVA. Barr and Actavis competed, and the price rose. This is the strongest practical answer to: how do we discover market value? Let multiple qualified buyers: compete. Additional test: who created the weak balance sheet?
In transition-era sales, debt must be a subject of investigation, not merely a deduction from price. We need to ask whether it arose from the loss of the common market, technological lag and recession; poor management; a debt-financed takeover; related-party transactions; transfers of assets; or a combination of these factors. Only then can we understand whether a low price reflects an external shock, business failure, asset depletion or several processes at once. Pattern E: a higher bidder exists but does not win. The most interesting example: Ferronikeli. Such a case requires focused investigation of qualifications, conditions of both bids, commission decisions and later changes. Here the word: “controversial” is not empty rhetoric. It has a concrete documented procedural basis.
The biggest mistake: using the book value of land as the automatic sale value of a company
A great deal of political controversy over former industrial complexes revolves around: land. A factory may perform poorly while sitting on coastline, the edge of a city, a logistics location and tourism-potential land. If the privatization price reflects mainly: the poor operating condition of the enterprise, but the buyer later converts the land into: a real-estate project, a very large capital gain can arise. But proving undervaluation requires the zoning designation at the time, the realistic probability of a zoning change, a land valuation, the actual land area included in the transaction and demolition and remediation costs. Without that, the statement: “the land alone was worth more”
may be true, but remains: unproven. Second major mistake: treating a later resale price as pure profit of the first buyer. NKBM is the clearest case. If the first buyer merges banks, acquires Abanka, reduces costs, increases earnings and changes the portfolio. then the later sale: is not the sale of the same asset. The same applies to an industrial company after EUR 200 million of investment, a decade of operation and entry into new export markets.
Third major mistake: ignoring state guarantees after privatization. If a private owner receives a state guarantee, subsidized electricity, a state loan and tax write-offs, the real economics of privatization changes. That is why this article separates in the KAP case: the 2005 sale price from the later public risk exposure. Kranj and Tržič: the price of a bankruptcy estate is not the value of the former industrial system.
Gorenjska shows why the timeline matters. By 1994 about 9,000 industrial jobs had disappeared in the region.[40] Tekstilindus entered bankruptcy as an over-indebted company, while contemporary reporting said its factory was sold relatively cheaply at auction.[41] Peko was still producing almost four million pairs of shoes in 1990 and ended in bankruptcy a quarter of a century later.[42] Planika production in Kranj was not preserved after bankruptcy, although the former complex later found new business users.[43]
This does not prove a single plan to destroy Gorenjska industry. It does show why it is insufficient to say: “the company was indebted at the time of sale, therefore the price was understandable.” Debt is only one line in the final chapter. The investigation must also reconstruct how production was lost, who made the decisions, what was sold separately and who controlled the land, halls, machinery and brands after production ended.
Gorenjska under the microscope: from industrial system to bankruptcy estate. If we look only at the final balance sheet before bankruptcy, the story is already almost over. That is precisely why such a view can mislead. A bankruptcy estate is the remainder of a process, not a measure of everything the company represented one or two decades earlier. In Kranj and Tržič the path can be followed concretely enough to show that the mechanisms of decline differed and that what survived after production was not the same thing as the former industrial system.
| Company | Before collapse | Documented break | What happened to production and assets |
|---|---|---|---|
| Tekstilindus Kranj | Around 1,500 employees in its best period; approximately 1,500 people were still attached to the company when bankruptcy began in 1991. | Loss of the Yugoslav market, indebtedness and large losses; bankruptcy in November 1991.[41] | Contemporary reporting said the factory was sold relatively cheaply at public auction, while creditors were repaid in full. Aquasava acquired part of the viable production and employed more than 500 people, mostly former Tekstilindus workers; other assets were sold separately.[41][47] |
| BPT Tržič | More than 1,500 employees at the height of development; in 1990 management warned that around 800 jobs were at risk. | A prolonged crisis and repeated rescue efforts. In 1999 workers wrote to the municipality that production was being dismantled and alleged cheap sales or scrapping of machinery and leasing of parts of the complex.[44] | Those were contemporaneous worker allegations, not a judicial finding of deliberate asset stripping. What is undisputed is that textile production disappeared and the complex then deteriorated for decades before receiving new uses.[46] |
| Peko Tržič | Almost 4 million pairs of shoes produced in 1990.[42] | A prolonged contraction after ownership transformation; insolvency and bankruptcy in January 2016. | At bankruptcy, more than EUR 8m of claims had been recognized against estimated assets of about EUR 6.5m; most value was in real estate and the Peko brand had a liquidation valuation of EUR 374,000.[45] Sales and leases of real estate, equipment, stock and other parts of the estate followed. |
| Planika Kranj | Once one of the larger footwear producers in Europe. | Difficulties from 1995, an initial bankruptcy and rescue with state assistance; final bankruptcy in 2004.[43] | Production in Kranj did not survive. The Kranj complex was sold in parts for about EUR 4.5m; the Turnišče production operation and the brand were sold for around EUR 2m and continued operating.[43] |
This comparison shows why the sentence “the company was only worth that much when it was sold” is often analytically too short. For Peko, the 2016 asset estimate of EUR 6.5m can be stated precisely. But that number does not explain how the company moved from almost four million pairs of shoes in 1990 to a bankruptcy estate a quarter-century later. Likewise, Planika’s final property sales do not explain why production disappeared in Kranj while the sold production operation in Turnišče was able to continue. The price of the remainder is not the history of the company.
Does this prove deliberate weakening? Not as a single conclusion for all companies. In the BPT case there is an important contemporaneous document: workers were already publicly warning in 1999 that machines were being sold cheaply or removed and that parts of the property were being leased.[44] This shows that concern about the disposal of assets existed during the decline itself, not only in later collective memory. It does not by itself constitute a final judicial finding that someone directed a plan to destroy BPT deliberately.
Establishing such intent in an individual company would require a decision trail: management and supervisory-board minutes, valuations, buyers of connected assets, credit flows, machinery and land sales, zoning changes and any judicial findings. The article therefore does not presume intent — but it also does not exclude it merely because the company was indebted at the end. Indebtedness is a condition; the research question is how it arose and who obtained assets, influence or cash flow from the process.
Not every irregularity is a crime — but an irregularity is not merely a technical footnote. Who Got the Socially Owned Assets? Major Privatizations, New Owners and Lost Companies from Slovenia to Kosovo showed the Croatian example a large share of audited privatizations contained irregularities. But an irregularity may mean a procedural error, a missing valuation, an unfulfilled development programme, an administrative breach, a misdemeanour and/or suspicion of a criminal offence. This article therefore uses the word: corruption only where there is a final judicial finding, an official criminal finding and/or a clearly attributed allegation labelled as such.
Comparative matrix: what does the purchase price actually tell us?
| Case | Purchase price / transaction | Major additional element | What may NOT automatically be inferred |
|---|---|---|---|
| NKBM | EUR 250m for 100% | EUR 870m capital need; BAMC; later acquisition of Abanka | EUR 620m = proven undervaluation |
| NLB | ~EUR 779m total privatization proceeds; state retains 25%+1 | EUR 1.551bn recapitalization | EUR 772m = proven sale loss |
| PLIVA | ~USD 2.5bn | competitive bidding between Barr/Actavis | price necessarily “perfect,” although strongly market-tested |
| INA | USD 505m for 25%+1 (2003) | later higher market offer and governance rights | higher 2008 price = proof of 2003 undervaluation |
| Sartid | ~USD 23m | ~USD 1.7bn old debts not assumed; ~USD 150m investment | debt = equity value |
| BH Steel | USD 80m for 51% | ~USD 200m investment; plant idle for years | physical scale = higher market value |
| KAP | EUR 48.5m for 65.44% | ~EUR 132m later state guarantees; bankruptcy | all guarantees = original privatization discount |
| Stopanska | DM 94m for 85% ordinary shares | DM 235m government bonds for bad claims | 235 − 94 = undervaluation |
| MakTel | EUR 343.3m for 51% | change in debt/equity structure | reduction from EUR 362.5m = arbitrary discount |
| Ferronikeli | EUR 30.55m final contractual price | earlier higher bid ~EUR 49m; EUR 20m investments | automatically proven theft |
| Sharrcem | EUR 30.1m | EUR 35m investment; direct negotiations | purchase price alone = total economic value |
Which cases present the strongest evidentiary pricing question? This article does not rank them. But it can classify: the type of evidentiary problem. Ferronikeli. There is a documented higher nominal offer. Therefore it is necessary to explain: why it did not become the final sale. KAP. The biggest issue is not necessarily the initial purchase price. It is: the large public credit risk created after privatization.
Sartid. The central issue is the combination of very low purchase price, exclusion of enormous historic debt and a bankruptcy procedure criticized by the official anti-corruption body. NKBM/NLB. The central issue is: confusing the cost of bank rescue with the value of the privatized equity stake. PLIVA. The strongest feature is: actual price competition among multiple strategic buyers. What should be checked before saying “sold for peanuts”? For every company:
- valuation date;
- who prepared the valuation;
- methodology used;
- net debt;
- cash and receivables;
- land and zoning;
- environmental obligations;
- required investment;
- number of qualified bidders;
- highest bid;
- reason for rejecting higher bids;
- assumed debts;
- state write-offs or guarantees;
- employment commitments;
- later state subsidies;
- later acquisitions and recapitalizations.
Only then can we say: the price was probably below market value or: the evidence does not support that claim. What can we state with high confidence from the evidence? Public restructuring before privatization was enormous for some banks. NLB, NKBM and Stopanska Banka clearly demonstrate this.[1][2][29] It is methodologically incorrect to directly subtract restructuring costs from sale price.
They are different economic categories. NKBM was sold for EUR 250 million after a competitive process. The later OTP acquisition price for NKBM was not publicly disclosed. PLIVA experienced genuine competitive bidding up to roughly USD 2.5 billion. INA was partially sold to MOL in 2003; later share purchases occurred at significantly higher nominal prices. That alone does not prove the original 25% package was undervalued.
Sartid was sold for about USD 23 million without the buyer assuming about USD 1.7 billion of old debt. The Sartid bankruptcy and sale procedure was criticized by Serbia's Anti-Corruption Council. KAP was privatized for EUR 48.5 million and the state later bore more than EUR 100 million in realized guarantee costs. That proves major later public risk, not by itself an undervalued 2005 sale.
Stopanska Banka was sold only after major balance-sheet cleaning with public bonds. Ferronikeli has a documented higher earlier bid and a lower final sale price. Sharrcem was sold for EUR 30.1 million with an additional EUR 35 million investment commitment. A later dispute emerged concerning fulfilment of Sharrcem's investment obligation. Book value, nominal capital and pre-war value are not by themselves market price.
The most honest answer to the title question
Was the socially owned property of former Yugoslavia sold too cheaply? For the region as a whole: that cannot be established with one number or one slogan. Some deals show competing bids, a market-tested price and substantial investment. Others show a single bidder, large prior public restructuring, later state guarantees, bankruptcy, procedural irregularities and/or a documented higher offer that did not become the final sale. The answer therefore has to be: case by case. The most important conclusion of this article is even more fundamental: the privatization purchase price is only one line in a much larger account. To understand who really gained and who carried the cost, we must add together:
- purchase price;
- debts;
- public restructuring;
- investment;
- subsidies;
- guarantees;
- land;
- later takeovers;
- bankruptcy losses.
After examining price, the question moves to people, financing and business networks: New Owners and Old Connections: Management Buyouts, Banks, Business Networks and Judicially Proven Abuse in Post-Yugoslav Privatization.
Sources and further reading
- Government of Slovenia / Ministry of Finance. December 2013 banking review: capital needs NLB EUR 1.551bn, NKBM EUR 870m, Abanka EUR 591m. Source
- Government of Slovenia. Banking stabilization 2013–2014: EUR 3.647bn recapitalizations; EUR 4.9bn gross risky exposures transferred to BAMC at transfer value EUR 1.6bn. Source
- Slovenian Sovereign Holding. Nova KBM: 100% sold to Apollo/EBRD, sale value EUR 250m. Source
- EBRD. NKBM acquisition; Apollo/EBRD selected as preferred buyer following competitive bidding. Source
- OTP Group. Acquisition of Nova KBM from Apollo/EBRD; financial terms not disclosed. Source 1 Source 2
- Government of Slovenia. Abanka sale to NKBM for EUR 444m; NKBM was previously fully privatized. Source
- Slovenian Sovereign Holding. 2018 NLB sale: 65% for approximately EUR 669.5m. Source
- Government of Slovenia. NLB privatization proceeds approximately EUR 779m; state retains 25% + 1 share. Source
- Barr Pharmaceuticals / SEC. Initial 2006 Barr proposal for PLIVA, approximately USD 2.2bn. Source
- Actavis. Increased PLIVA offer to HRK 795 per share, valuing issued share capital at approximately USD 2.5bn. Source
- Barr Pharmaceuticals / SEC. Final USD 2.5bn cash tender offer at HRK 820 per share; 92% tendered. Source
- Actavis. Withdrawal from PLIVA contest after declining to exceed HRK 820. Source
- Government of Croatia. Decision of 17 July 2003 approving sale of 25% + 1 INA share to MOL. Source
- MOL Group. Historical investor presentation: initial INA 25% + 1 package USD 505m; later increase to 47.1% about USD 1.18bn. Source
- HANFA. MOL voluntary 2008 INA offer at HRK 2,800 per share; HRK 266.66 above prior three-month weighted average. Source
- Government of Croatia. 2022 ICSID award in MOL v. Croatia; government summary of accepted and rejected claims. Source
- Contemporary reporting / U.S. Steel transaction. Sartid sale approximately USD 23m, debts estimated at USD 1.7bn excluded, investment commitments. Source
- Anti-Corruption Council of Serbia. The Sartid Bankruptcy Report, 2004. Source
- Contemporary reporting / Serbian steel plant. U.S. Steel later sold the operation back to the Serbian state for USD 1 in 2012. Source
- Government of Serbia. Hesteel 2016 purchase of 98 Smederevo steelworks asset units for EUR 46m. Source
- Development Agency of Serbia / Government reporting. Hesteel investment plan and employment commitments. Source
- World Bank. Zenica steel mill: Mittal paid USD 80m for 51%, committed further USD 200m; plant had been idle for years after war. Source
- CEAC v. Montenegro arbitration record / KAP SPA. 65.4394% of KAP shares sold for EUR 48.5m in 2005. Source
- IMF. Montenegro 2012: KAP total debt around EUR 350m, about EUR 132m covered by state guarantees. Source
- Government of Montenegro. Approximately EUR 102.5m of KAP guarantees paid in 2013. Source
- Central Bank of Montenegro. About EUR 102.8m paid under KAP guarantees in Q3 2013. Source
- Government of Montenegro. KAP bankruptcy and sale of assets to Uniprom in June 2014. Source
- Montenegro bankruptcy/public procurement documentation. KAP remaining assets sold to Uniprom for EUR 28m with planned investments around EUR 76m. Source
- IMF. Stopanska Banka restructuring: DM 235m government bonds replacing bad debts; DM 94m agreed price for 85% ordinary share capital. Source
- Matáv / Magyar Telekom. MakTel 51% acquired for EUR 343.3m; difference from EUR 362.5m tender offer due to lower debt-to-equity conversion. Source
- IMF. 2001 Macedonia: approximately USD 323m telecom privatization receipts supported reserves. Source
- Radio Free Europe. Adi-Nikel provisional Ferronikeli bid of approximately EUR 49m; only two bidders. Source
- Radio Free Europe. Contemporary criticism of Ferronikeli procedure and minimum-bidder rules. Source
- Radio Free Europe. Alferon later selected with reported offer around EUR 33m plus investment/employment commitments. Source
- Privatization Agency of Kosovo. Ferronikeli final recorded sale price EUR 30,554,371; EUR 20m committed investment; employment commitments. Source
- NUPI. Privatization in Kosovo: The International Project 1999–2008. Analysis of Ferronikeli procedure and privatization governance. Source
- Privatization Agency of Kosovo. Sharrcem: EUR 30.1m purchase price, EUR 35m investment commitment and employment conditions. Source
- Privatization Agency of Kosovo. 2014 monitoring: PAK identified risk that the EUR 35m Sharrcem investment obligation might not be fully realized by deadline. Source
- Titan Cement. Company position in later arbitration: claimed EUR 35.1m invested by end-2015 versus PAK calculation of around EUR 25.6m. Source
- Gorenjski glas. “Three decades of the Gorenjska economy”: roughly 9,000 industrial jobs lost in Gorenjska by 1994. Source
- Gorenjski glas, 1996. Tekstilindus entered bankruptcy because of over-indebtedness; contemporary reporting said the factory was sold relatively cheaply at public auction, while creditors were repaid. Source
- Delo. Peko: almost four million pairs of shoes in 1990; after privatization, prolonged decline ending in bankruptcy in 2016. Source
- Gorenjski glas. Planika: difficulties from 1995, about EUR 8m of state assistance in the first rescue; after the 2004 bankruptcy production in Kranj did not survive. The Kranj complex was sold in parts for about EUR 4.5m, while the Turnišče operation and the brand were sold in 2005 for about EUR 2m; production in Turnišče continued. Source
- Gorenjski glas, 1999. In a letter to the Tržič municipality, BPT workers warned about the deterioration of production and alleged that only about half of 123 weaving machines remained, while others had been sold cheaply or scrapped; they also raised concerns about other equipment sales and leasing of facilities. These were contemporaneous worker allegations, not a judicial finding. Source
- Gorenjski glas, 2016. Peko in bankruptcy: more than EUR 8m of recognized claims versus an estimated asset value of about EUR 6.5m; most value was in real estate, while the Peko brand had a liquidation valuation of EUR 374,000. Source
- Municipality of Tržič, 2020. After nearly three decades of deterioration, the former BPT site began receiving new uses; the municipality explicitly notes that weaving had long ceased in the complex. Source
- Gorenjski glas, 1996. After Tekstilindus entered bankruptcy, Aquasava acquired part of the viable production and at the time employed more than 500 people, mostly former Tekstilindus workers; other assets were sold to repay creditors. Source