Schumann Resonance: Does Earth Have an Electromagnetic Heartbeat?
When we encounter the term Schumann resonance online, it is often accompanied by an alluring image of Earth surrounded by glowing waves.

When we encounter the term Schumann resonance online, it is often accompanied by an alluring image of Earth surrounded by glowing waves. Sometimes the number 7.83 Hz appears beside it, labelled the “heartbeat of the planet.” Elsewhere, a purported spectrogram is said to show that “Earth’s frequency has suddenly increased,” that a major shift in consciousness is approaching, or that altered electromagnetic oscillations are making people tired, anxious, or spiritually awakened.
This story did not arise out of thin air. Earth really does exhibit a measurable, scientifically studied family of electromagnetic resonances in the extremely low frequency range. They emerge from the interaction of thunderstorms around the globe, the electrical properties of the atmosphere, and the vast space between the planet’s surface and the ionosphere. The phenomenon is sufficiently interesting to attract atmospheric physicists, researchers in atmospheric electricity, and space-weather scientists. [3][4]
But Schumann resonance is not an audible note emitted by Earth, not a single unchanging signal, and not a direct measurement of human consciousness. To understand why it has become such a popular symbol of “planetary vibration,” we first need to examine what is actually being measured.
Earth as an electromagnetic resonator
A vast natural region for the propagation of electromagnetic waves surrounds Earth. Its lower boundary is the relatively conductive surface of the planet, while its upper boundary consists of the more conductive layers of ionized atmosphere known as the ionosphere. Electromagnetic waves with very long wavelengths can travel through the space between them. Together, Earth and the ionosphere form a global, though imperfect, resonator. [1][3]
Resonance means that a system responds more strongly to some frequencies than to others. A useful analogy is a vibrating string or the air column in a musical instrument: when conditions support a particular mode of vibration, energy can build up more readily in that mode. But Schumann resonance does not involve air vibrating as it does in sound. It involves oscillating electric and magnetic fields, with waves propagating through the space between the surface and the ionosphere.
At the extremely low frequencies known as ELF (extremely low frequency), wavelengths are comparable to the dimensions of the planet. Electromagnetic pulses can therefore travel around Earth and combine or interfere with one another. Characteristic resonant modes emerge in particular frequency ranges and appear as peaks in measured spectra. [3][5]
That is the physical meaning of Schumann resonance. Earth does not literally “sing” in an acoustic sense, nor does this resonance mean that the entire planet mechanically contracts and expands seven or eight times per second. It is an electromagnetic property of the Earth–atmosphere–ionosphere system.
Lightning: countless pulses, one planetary system
What excites this resonator? Primarily thunderstorms and lightning occurring around the world. Each lightning discharge produces a rapid change in electrical currents and, with it, an electromagnetic pulse containing a broad range of frequencies. Some of that energy falls within the ELF range and can propagate through the global waveguide. [3][4]
Lightning does not occur at a uniform rate. Discharges arise in different storm systems, on different continents, and at different times. Major regions of activity include tropical Africa, South America, and Southeast Asia. As Earth rotates and thunderstorm regions develop and shift over the course of a day, the contribution of individual sources to the measured signal also changes. [3][5]
That is why Schumann resonance is not the output of a single transmitter continuously producing a pure 7.83 Hz tone. It is an electromagnetic phenomenon that is constantly excited and simultaneously damped. Individual pulses occur irregularly, but their combined energy is preferentially expressed in certain frequency bands by the global resonator. A signal can therefore be present even when there is no thunderstorm near a measuring station.
The phrase “Earth’s heartbeat” can be a useful metaphor if it refers to the planet’s dynamic electrical activity. It becomes misleading when it suggests that one biological frequency governs all life.
From Schumann’s prediction to actual measurements
In 1952, the German physicist Winfried Otto Schumann mathematically examined the electromagnetic natural modes of a system comprising a conducting sphere, a surrounding layer of air, and an ionospheric shell. He showed that such a system should support resonant oscillations. His calculations also addressed damping and the conductivity of the upper boundary. [1]
In early idealized models with perfectly conducting boundaries, the lowest calculated frequency differs from the one actually observed: approximately 10.6 Hz rather than approximately 7.8 Hz. This is not a mysterious error; it is a reminder that the real atmosphere is not a perfect metallic cavity. The finite conductivity and structure of the ionosphere, energy losses, and propagation conditions substantially alter its resonant response. [1][4]
In 1960, Martin Balser and Charles A. Wagner published observations of Earth–ionosphere cavity resonances in Nature. Their work marked an important milestone in experimentally confirming the phenomenon: rather than dealing only with theoretically predicted modes, researchers could identify characteristic spectral peaks within electromagnetic noise. [2]
The field has expanded considerably since then. Measurements have become useful for investigating global lightning activity, the electrical properties of the ionosphere, and changes in the propagation of extremely low-frequency electromagnetic waves. Schumann resonance is now an established subject of atmospheric physics, not a fringe scientific phenomenon. [3][4]
Why 7.83 Hz is not Earth’s only “frequency”
The most widely circulated number is approximately 7.8 Hz, often given more precisely as 7.83 Hz. This is the approximate region of the first, and usually best-known, resonant peak. But measurements also reveal higher modes, approximately at 14, 20, 26, 32, and 38 Hz. Their measured positions and prominence vary. [3][5]
Importantly, these frequencies are not simply exact integer multiples of the fundamental frequency, as might be expected of an ideal string. Earth’s geometry, the physics of the ionosphere, and damping produce a different pattern of modes. It is therefore more accurate to speak of resonant modes than of a perfectly regular harmonic series.
The figure 7.83 Hz is a useful reference value, not a universal constant that remains identical to the nearest hundredth of a hertz at every time and measuring location. Measured spectral peaks have finite widths, and their frequencies can differ slightly depending on waveguide conditions, the positions of lightning sources, and the measurement method. [4][6]
A study by Oleksandr Koloskov, Masashi Hayakawa, and Alexander P. Nickolaenko, published in September 2026, examines the spatial characteristics of global thunderstorm activity in greater detail. The authors show how changes in observed resonant peaks, when interpreted with suitable modelling and calibration, can help estimate the average distance and spatial extent of thunderstorm regions. Crucially, they distinguish the frequencies of maxima in the measured spectrum from the natural frequencies of an idealized system. [6]
This has an important implication for everyday interpretations of such measurements. If a peak shifts slightly in a particular recording, we cannot conclude that Earth as a whole has “switched to a new frequency.” We must first understand what the instrument detected and what could have influenced its spectral response.
How is Schumann resonance measured?
Because the relevant signal components are very weak and spread across a low-frequency range, measurements require suitable sensors and careful processing. Some stations use magnetic induction coils to monitor horizontal components of the magnetic field; others use specialized antennas to measure the vertical electric-field component. Recordings are then filtered and analysed to identify the characteristic peaks. [3][5]
Such an instrument is not a microphone. Although the frequencies are expressed in hertz, that does not mean an audible sound is being recorded. Hertz is a unit of repetitions per second, used for sound, electromagnetic waves, flashing light, and many other processes. The same unit does not make those processes physically identical.
Low-frequency measurements are also vulnerable to interference. Electric power systems operating at 50 or 60 Hz, nearby electronics, charged particles, vegetation movement, and weather events can affect recordings. Researchers therefore use filtering, comparisons between measurement channels, and appropriate analysis procedures. [5]
The study by Pizzuti, Bennett, and Füllekrug of long-term observations near Portishead in the United Kingdom provides an especially instructive example. The researchers used a sensitive electric-field sensor that had not originally been designed primarily to study Schumann resonance, extracting valuable electromagnetic information from several years of measurements. Their work shows that the phenomenon can also be monitored with equipment designed for other purposes, provided its limitations are understood and the data processed correctly. [5]
Spectrograms: what do the bright horizontal bands mean?
Colourful images showing bright bands often circulate online. Some are genuine scientific spectrograms; others are cropped, mislabelled, or presented without any explanation of their origin. Understanding them requires a distinction between a spectrum and a spectrogram.
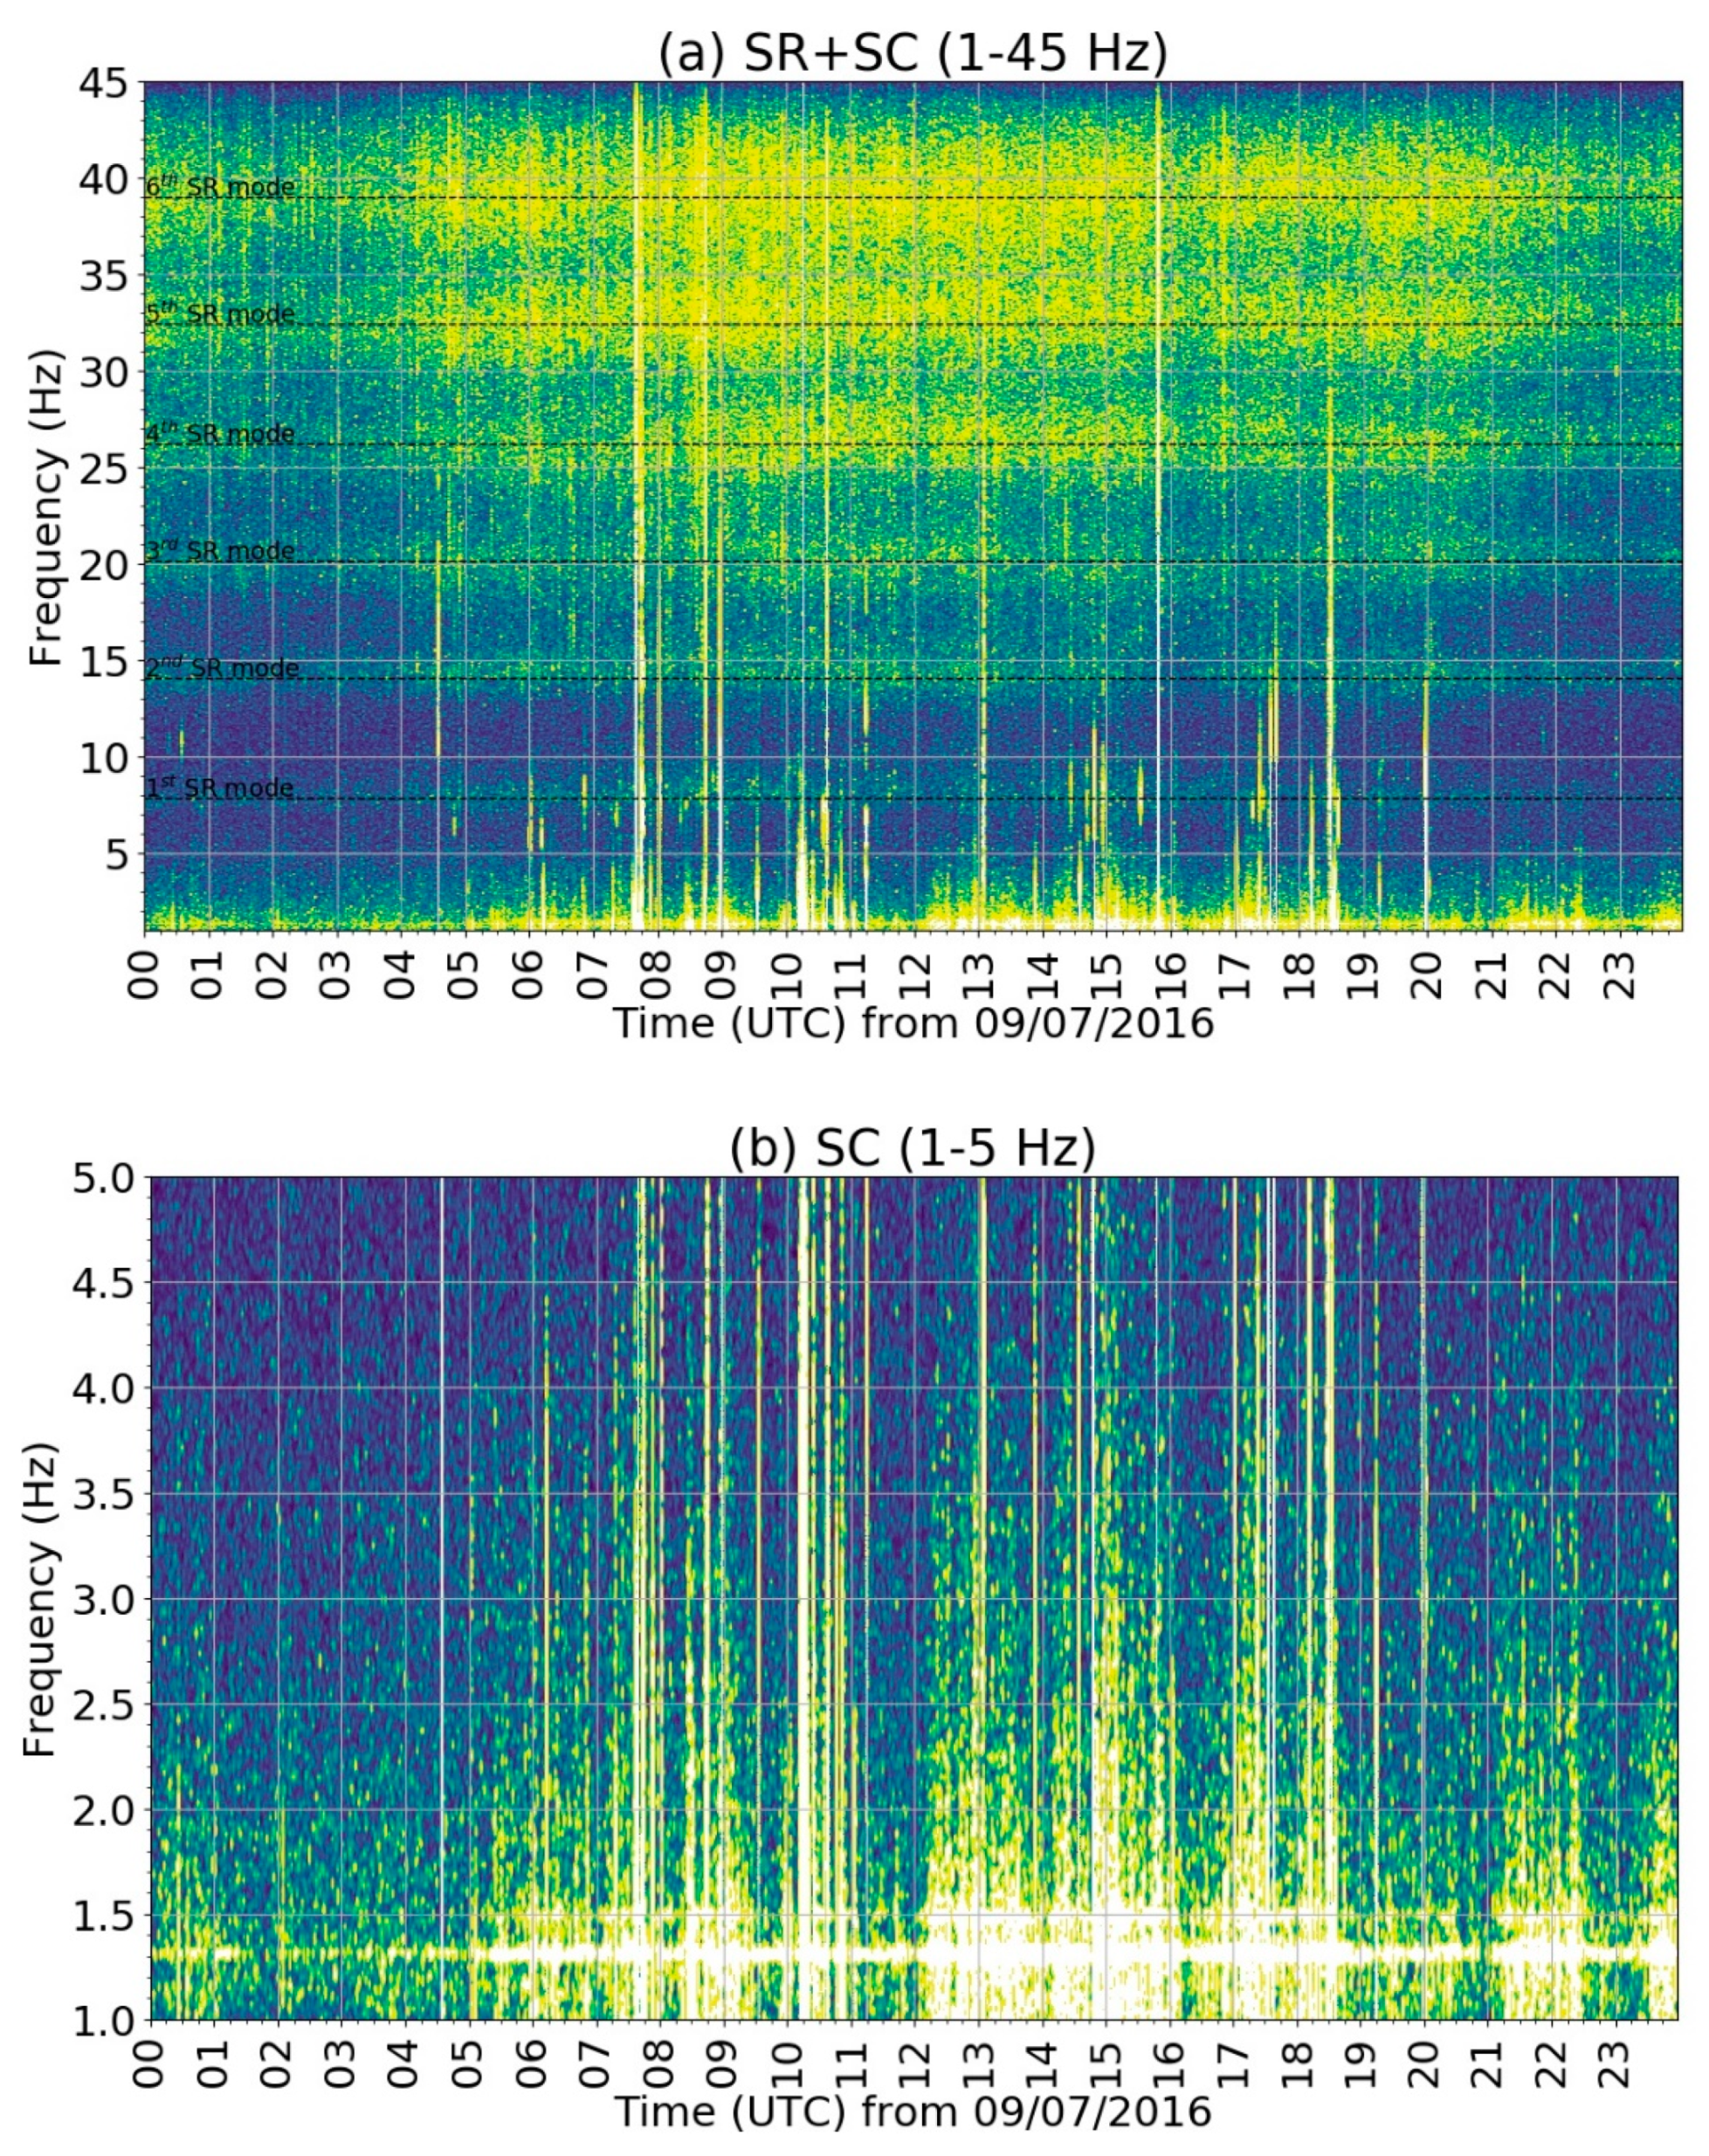
A spectrum shows how the power, or another characteristic, of a measured signal is distributed across frequencies over a particular time interval. A spectrogram adds the dimension of time: one axis generally represents time, another frequency, while colour or brightness indicates signal intensity in a particular region. Over longer recordings, resonant modes may appear as relatively persistent horizontal bands.
Figure 2 of the Portishead study shows such bands at approximately 8, 14, 20, 26, 32, and 38 Hz. The researchers also point out vertical traces of brief local disturbances and stronger effects from local phenomena at the lowest frequencies. [5]
We must also distinguish colour intensity from frequency. If part of a spectrogram becomes brighter, this may indicate a stronger measured signal or interference; it does not mean the fundamental resonance has “jumped” from 8 to 30 Hz. A band near 30 Hz may correspond to a higher resonant mode or another source of signals. Without axes, units, measurement location, and an explanation of data processing, sensational interpretations of such images are unfounded.
Daily and seasonal variations: Earth is not a laboratory sphere
Schumann resonance measurements are not exactly the same from hour to hour. Signal strength and spectral shape vary, as does, to some extent, the position of the observed peaks. There are several reasons: thunderstorm activity shifts between different parts of the world; day and night alternate; the electrical conductivity of the upper atmosphere changes; and seasonal conditions and some space-weather factors have an influence. [3][5][6]
An observatory therefore does not measure a simple worldwide number independent of its location. A record from Europe may respond differently to the distribution of thunderstorm sources than a record from Antarctica. When comparing measurements, one must consider which field components were recorded, how the sensors were calibrated, and what conditions affected signal propagation.
In the Portishead study, the authors described daily and seasonal variations consistent with the influence of major tropical thunderstorm regions. They also suggested a possible connection between some year-to-year changes in the signal and changing climatic and oceanic conditions, including during the strong 2015–2016 El Niño. This is not a simple formula in which a stronger signal automatically corresponds to a particular global temperature. [5]
Schumann resonances can be a valuable indirect source of information about global thunderstorms and the ionosphere. They are not, however, a universal stand-alone gauge of every change taking place on the planet.
“Earth’s frequency is accelerating”: what does this claim overlook?
One of the most widespread modern claims holds that Earth once oscillated at 7.83 Hz but that its frequency is now rising toward 20, 30, or even 40 Hz. This alleged change is often said to affect people’s perception of time, sleep, emotions, and the evolution of consciousness.
The problem is not merely the unusual terminology; it is the interpretation of the data. Schumann resonance already includes several higher modes under ordinary conditions. Their presence does not mean that the fundamental resonance has leapt to a new value. Nor does a sharp increase in amplitude, a short-lived local disturbance, or a shift in the spectral maximum demonstrate a permanent change in all of Earth’s electromagnetic properties. [3][5][6]
When confronted with an unfamiliar image, we should first ask: Which station recorded it? When was it recorded? What type of sensor was used? Does the vertical axis show frequency or amplitude? What does the colour scale represent? Are we looking at a raw signal or processed spectral power? Are local disturbances present? And has a similar event been confirmed by multiple independent stations?
Without that information, a graph cannot substantiate claims about the “acceleration of time” or a global transformation of consciousness. This limitation does not make the measurements less scientifically interesting; on the contrary, interpreting them correctly reveals how much information they contain.
Can humans respond to these electromagnetic rhythms?
It is not inherently unreasonable to ask whether natural electromagnetic fields may affect living organisms. Organisms operate through chemical and electrical processes, and some species can detect certain aspects of Earth’s magnetic field. But these facts do not, by themselves, establish that Schumann resonances directly regulate human consciousness, cure disease, or synchronize every brain on the planet.
A frequently cited observation is the numerical similarity between the fundamental resonance region around 8 Hz and certain frequency bands of electrical brain activity measured by electroencephalography (EEG). The numerical proximity is real, but the two measurements describe very different things: EEG records electrical activity in the brain, whereas Schumann resonance instruments measure electromagnetic fields in the atmosphere. A similar number does not automatically establish a causal connection.
The biological question is nevertheless being investigated. In 2025, Nevoit and colleagues published an extensive review arguing for physiological associations between Schumann resonances and certain indicators of nervous-system and cardiovascular function. The authors discuss correlational and theoretical evidence and propose several possible mechanisms. Importantly, they also acknowledge methodological difficulties, numerous confounding variables, and the lack of randomized controlled trials capable of establishing causality more reliably. [7]
It would therefore be wrong to declare every possible effect on humans conclusively ruled out. It would be equally wrong to turn individual research findings into a general guarantee of healing, disease prevention, or spiritual awakening. Researchers still need to establish the actual strength of exposure, which mechanisms might be biologically plausible, whether any effects are reproducible, and whether they can be distinguished from the effects of sleep, stress, weather, and other factors.
The most appropriate distinction at present is this: the physical existence of Schumann resonances is firmly established; some proposed biological associations remain under investigation; and sweeping claims of universal therapeutic or spiritual power do not enjoy the same level of evidential support.
The underground bunker: what did participants say about their well-being?
Among the most interesting historical experiments on possible human responses to weak natural electromagnetic fields are the studies conducted by Rütger A. Wever and colleagues at the Max Planck Institute for Behavioral Physiology in Erling-Andechs, Germany. These are often described as “the experiment with students in an underground room,” but the scientific publications warrant the more cautious terms volunteers or participants: that description does not demonstrate that everyone involved was a student. [8][9][10]
The researchers used two superficially similar underground living units, each equipped with a room, a small kitchen, and a bathroom. Participants spent approximately four weeks in these units, separated from the outside world and deprived of normal external time cues such as clocks and the natural alternation of day and night. One unit was additionally shielded from external electric and magnetic fields. In that unit, the researchers could also activate an artificial electromagnetic field without the occupants noticing. Participants did not know when the field was present. Their activity–rest cycles, body temperature, and other physiological variables were monitored. [8][10]
What did the researchers find? In the electromagnetically shielded unit, the average free-running circadian periods were longer, and some participants exhibited internal desynchronization: their sleep or activity rhythm was no longer aligned with their body-temperature rhythm. In an earlier set of observations, Wever reported an average period of approximately 25.65 hours in the shielded room versus 25.00 hours in the unshielded room. These numbers describe the groups of experiments considered at the time, not an immutable difference applicable to everyone. [8][9]
In subsequent tests, the researchers applied a weak alternating electric field at 10 Hz—not a generator set to exactly 7.83 Hz, as some later summaries claim. When the field was switched on, the internal period generally shortened in those experiments, and the observed desynchronization of different bodily rhythms also decreased. Wever interpreted the results as evidence that certain weak electric fields can influence human circadian timing under conditions of temporal isolation. [8][9][10]
But what did participants actually say about how they felt? Here the story takes an unexpected turn. Online accounts and even some later scientific publications repeat a version in which people deprived of the “Schumann frequency” supposedly became ill, developed headaches, felt anxious or depressed, and recovered when the field was restored. Panagopoulos and Balmori, for example, repeated such an interpretation in 2017. [11]
Yet in his own 1973 paper, Wever described a different overall impression: with very few exceptions, the participants felt very well during isolation, and many wanted to take part again after the experiment ended. This does not negate the measured differences in biological rhythms, nor does it prove that nobody experienced difficulties. It does mean, however, that claims of widespread illness, depression, or the disappearance of every symptom after the field was switched on should not be presented as direct, uncontested findings of this primary report. [10][11]
A further methodological distinction matters. The experiments took place under temporal isolation, which itself affects sleep–wake rhythms. Comparing shielded and unshielded units and switching an artificial field on and off allowed Wever to investigate an additional contribution from electromagnetic fields. But the results do not demonstrate that the absence of one particular atmospheric frequency caused every change in subjective well-being. Nor can they be transferred directly to everyday life, in which light exposure, social schedules, work, and many other factors exert powerful effects on circadian rhythms.
This is precisely why the experiment is valuable: it demonstrates a measurable relationship between experimental conditions and the biological organization of time, while revealing how easily such research can be retold as a simplified story about an “essential healing frequency of Earth.”
Why 7.83 Hz does not prove that music should be tuned to 432 Hz
Because popular accounts frequently invoke numbers associated with sound, Schumann resonance sometimes enters discussions about tuning music to A = 432 Hz. These arguments are often constructed from inventive numerical ratios, rounding, and moving frequencies across octaves.
But A = 432 Hz is the reference frequency of a particular musical note, whereas Schumann resonance denotes a family of electromagnetic modes in the atmosphere. They are different physical systems. Demonstrating a special natural or therapeutic connection would require a clearly defined mechanism and appropriate comparative measurements, not merely an attractive numerical resemblance.
That does not mean different tunings cannot affect how music is experienced. Differences in pitch can be audible, and musical experience depends on the instrument, performance, listener, and context. It does not follow that one reference pitch is directly “in tune with Earth’s heart.”
What does Schumann resonance really reveal?
Schumann resonances show us something remarkable: events that appear geographically isolated can belong to a common planetary electromagnetic system. A thunderstorm over tropical land can contribute to a signal detected by sensitive instruments at a station thousands of kilometres away. The structure of the ionosphere, the global distribution of storms, and the propagation of waves together shape the observed spectrum. [3][5][6]
For researchers, this signal is valuable because it carries information. It can reveal aspects of atmospheric electricity, distant thunderstorm regions, and the properties of the space through which electromagnetic pulses travel. That interconnectedness is extraordinary enough without adding the claim that all human consciousness is shifting into a new vibrational state.
The metaphor of “Earth’s heartbeat” can be poetic. But the best way to preserve its meaning is not to lose sight of what we are measuring. Schumann resonance is not mystical proof of all-encompassing harmony; it is a real example of how planetary geometry, the atmosphere, and thunderstorms produce a shared electromagnetic response.
Earth does not have a single unchanging frequency that determines our consciousness. It does have a dynamic electromagnetic system whose signals we are learning to read—and in those signals, we can recognize how profoundly events in different parts of the planet are connected.
Sources and further reading
- Schumann, W. O. (1952). Über die strahlungslosen Eigenschwingungen einer leitenden Kugel, die von einer Luftschicht und einer Ionosphärenhülle umgeben ist. Zeitschrift für Naturforschung A, 7(2), 149–154 Source
- Balser, M., & Wagner, C. A. (1960). Observations of Earth–Ionosphere Cavity Resonances. Nature, 188, 638–641 Source
- Price, C. (2016). ELF Electromagnetic Waves from Lightning: The Schumann Resonances. Atmosphere, 7(9), 116 Source
- Nickolaenko, A. P. (1997). Modern aspects of Schumann resonance studies. Journal of Atmospheric and Solar-Terrestrial Physics, 59(7), 805–816 Source
- Pizzuti, A., Bennett, A., & Füllekrug, M. (2022). Long-Term Observations of Schumann Resonances at Portishead (UK). Atmosphere, 13(1), 38 Source
- Koloskov, O., Hayakawa, M., & Nickolaenko, A. P. (2026). Deducing spatial characteristics of global thunderstorm activity using the observed Schumann resonance frequencies. Annales Geophysicae, 44, 949–957 Source
- Nevoit, G., Landauskas, M., McCarty, R., Bumblyte, I. A., Potyazhenko, M., Taletaviciene, G., Jarusevicius, G., & Vainoras, A. (2025). Schumann Resonances and the Human Body: Questions About Interactions, Problems and Prospects. Applied Sciences, 15(1), 449 Source
- Wever, R. (1967). Über die Beeinflussung der circadianen Periodik des Menschen durch schwache elektromagnetische Felder. Zeitschrift für vergleichende Physiologie, 56, 111–128 Source
- Wever, R. (1970). The effects of electric fields on circadian rhythmicity in men. Life Sciences and Space Research, 8, 177–187 Source
- Wever, R. (1973). Human circadian rhythms under the influence of weak electric fields and the different aspects of these studies. International Journal of Biometeorology, 17(3), 227–232. Primary text: Source 1 Source 2
- Panagopoulos, D. J., & Balmori, A. (2017). On the biophysical mechanism of sensing atmospheric discharges by living organisms. Science of the Total Environment, 599–600, 2026–2034. Secondary interpretation of Wever’s experiments; its account of subjective symptoms does not match the explicit general description of participants’ well-being in Wever (1973). Source